Data is at the heart of XDR. The ability to ingest petabytes of data real-time from any technology product or platform allows organizations to see and find security issues in a way never previously possible. However, to fully realize that potential, security analysts need tools that present that data in ways that make it easier to identify trends, patterns, and outliers within large data sets. Powered by Storyline and the same technology that underlies DataSet, the new Singularity XDR Process Graph empowers analysts by delivering context and insight through the power of visualization.
From the initial execution of a process to its classification by the SentinelOne agent and its correlation to the MITRE ATT&CK™ knowledge base, the new Process Graph exposes hidden connections, suspicious events, and a timeline of valuable Indicators of Attack (IOAs).
How the Process Graph Empowers Security Analysts
The new Singularity Process Graph offers security analysts multiple benefits.
Faster Triage
With Process Graph, analysts can reduce triage time by easily expanding and moving between processes and their graphs with one click. New graphs are opened without overriding the current view, maintaining context and allowing a side-by side graph investigation for faster triage.
Moreover, every process on the graph can be clicked to see additional information – from basic data such as its image path, signature and hashes to counters of behaviors performed by that process.
The graph timeline is now enriched with more data than ever before with related events, indicators of attack, cross-process activity and threat intelligence indications. Analysts can see aggregated information, drill down to a specific point in time to conduct further analysis, and click on any event or process to get more information.
Better Discovery
Process Graph uncovers hidden connections identified by the SentinelOne Storyline. While most products only present the chain of execution as seen by the OS, with Process Graph, analysts can choose either OS view or a more comprehensive view identified by the SentinelOne Storyline, with multiple correlated alerts appearing in one contextual story.
In addition, the analyst can choose to view cross processes just by clicking a checkbox. Cross-process connections are triggered when a process modifies another running process—injecting code, duplicating handles, or reading/writing memory in that process. The representation of cross-process activity provides more context by tracing threat execution from the original source to actions undertaken under the auspices of other supposedly legitimate processes.
Visibility Into the Cyber Kill Chain®
The new graph allows analysts to highlight processes identified with behaviors like evasion, exploitation, persistence, privilege escalation and more, immediately within the graph.
Highlighting processes based on the Cyber Kill Chain® framework enhances visibility into an attack and enriches the analyst’s understanding of an adversary’s tactics, techniques, and procedures.
Enhanced Correlation of TTPs with MITRE ATT&CK®
Adding to SentinelOne’s existing close integration with the MITRE ATT&CK® framework, the new graph allows analysts to view indicators at the process level, enriching the information available and leading to better understanding of further risk factors.
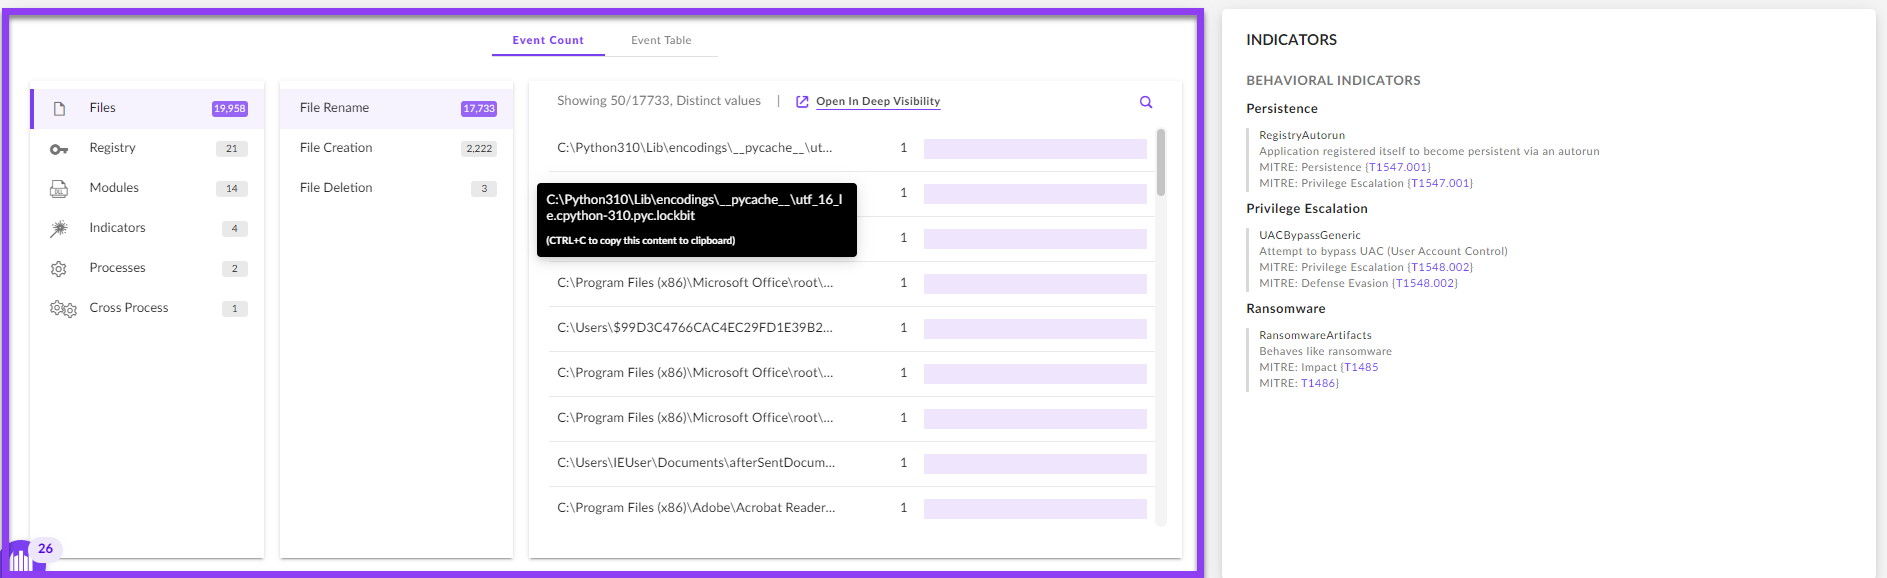
Behavioral indicators are now assigned to every individual process. With the graph, you can see which indicators are associated with each process and why, offering security teams a further way to understand the nature of a detection, even if it was prevented and did not cause any harm.
Instant Insights into Process Behaviors
The new graph utilizes PowerQuery to provide aggregations and statistics per process automatically, within milliseconds, allowing the analyst to quickly identify suspicious and malicious behaviors with no manual stitching needed.
The events table now displays up to 20,000 related events for the process node: its file, network, cross process, registry activity and more, as well as the indicators triggered on that process activity identified by the SentinelOne agent. Each individual value (or a mix of values) in the events table can be used to initiate a new investigation with a single click.
Process Graph Use Case | WastedLocker Ransomware
WastedLocker is a ransomware family that has been targeting high-value enterprises across industries since 2020, including US-based Fortune 500 companies.
WastedLocker is fully prevented and detected by the SentinelOne Singularity platform, but it provides a good case study to show how Process Graph can help analysts conduct root cause analysis.
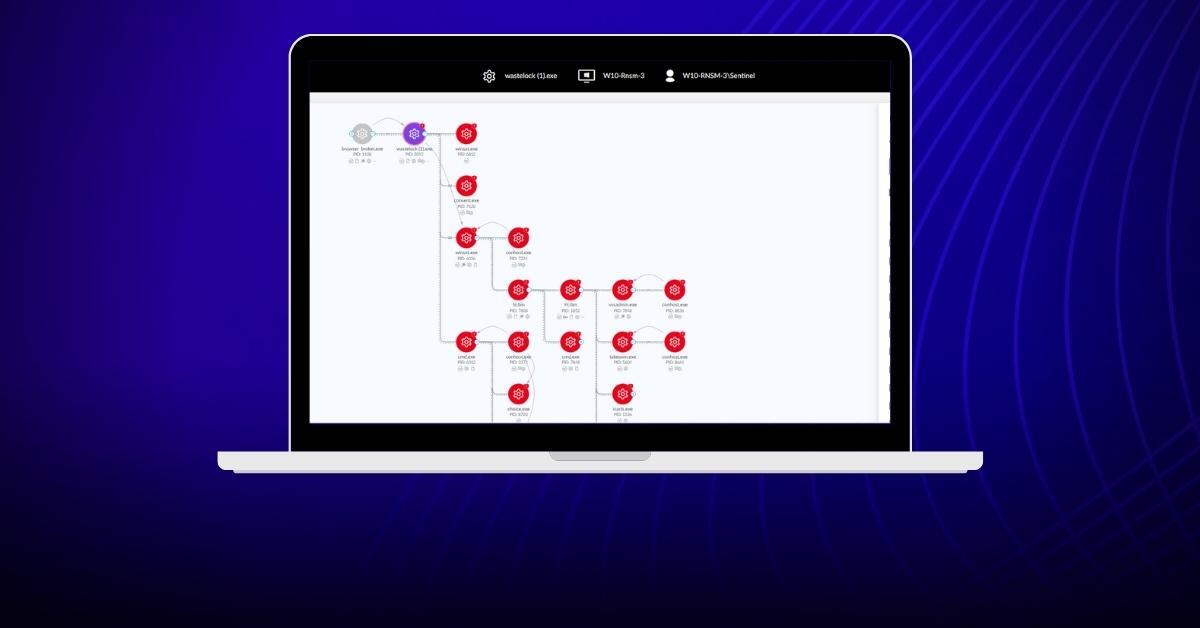
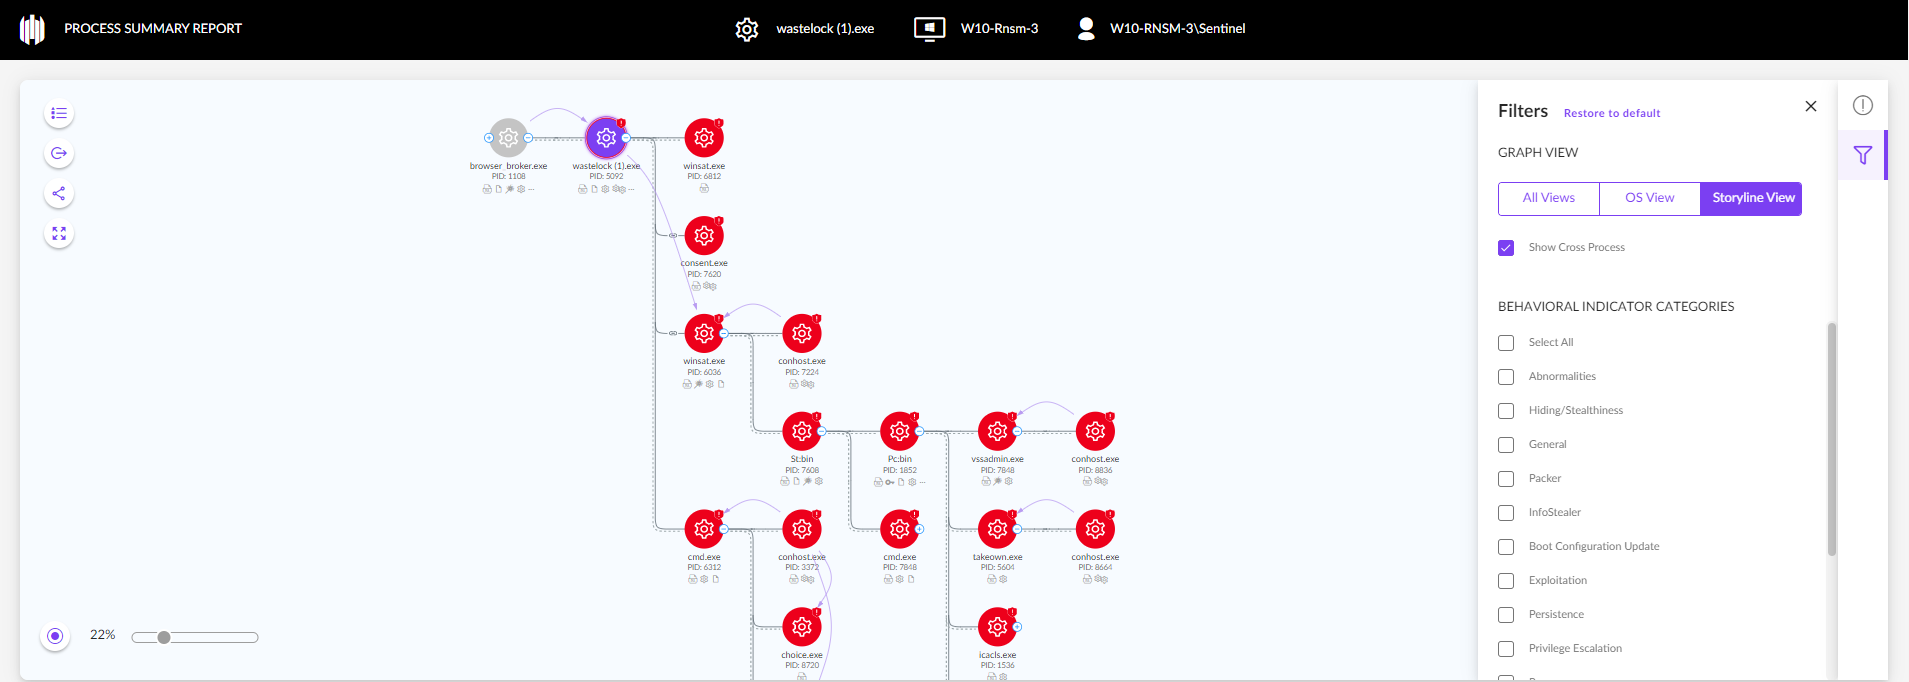
A process graph derived from operating system events alone would look as follows:
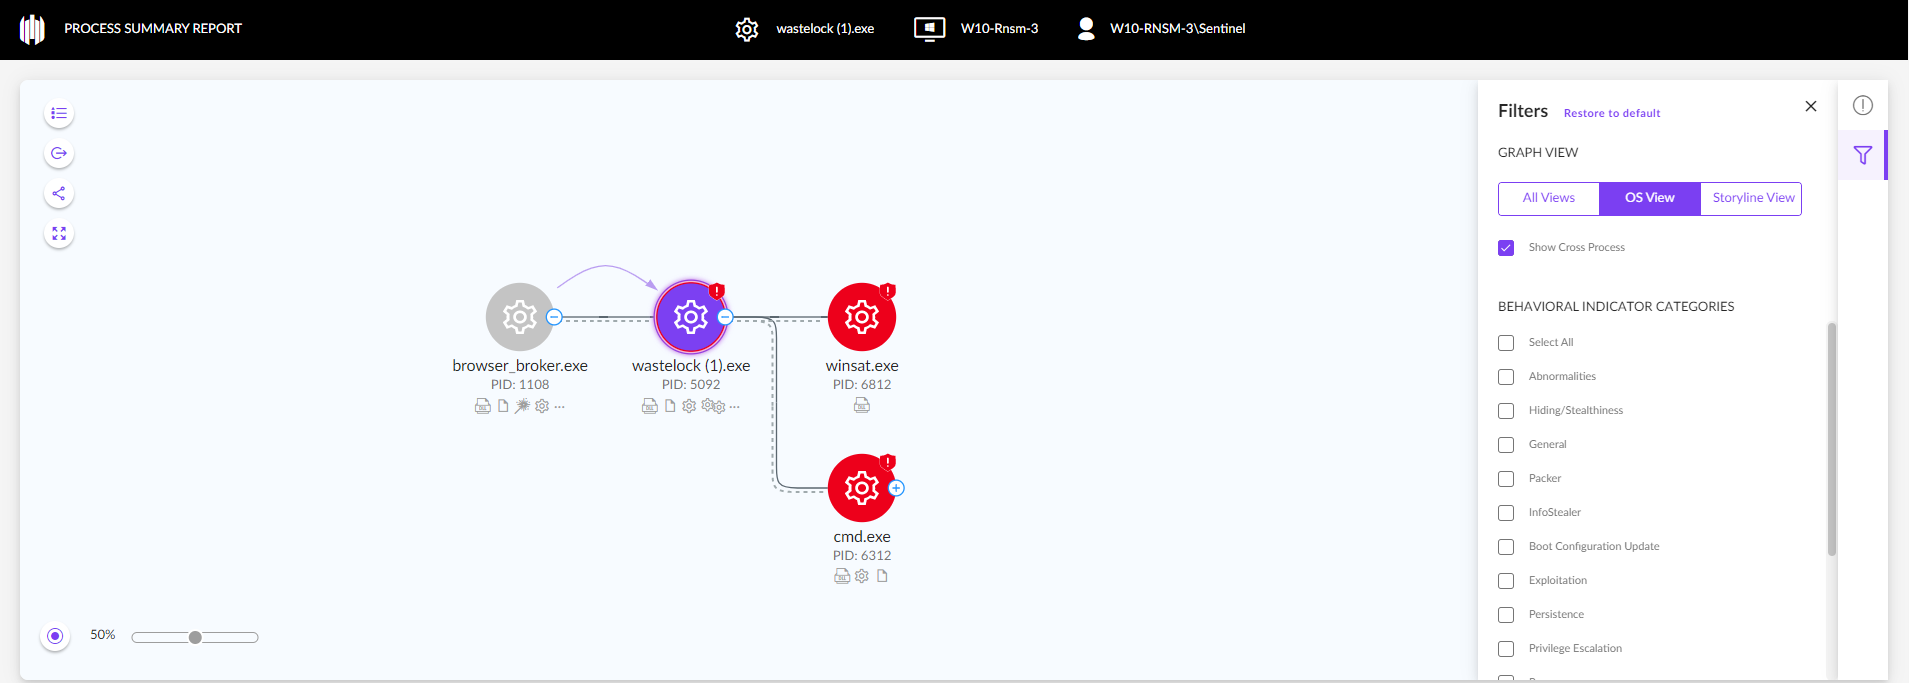
When in Storyline view, the graph reveals critical information like the deletion of Shadow Copies, a common technique used in ransomware activity.
Conclusion
Whether for threat analysis or threat hunting, SentinelOne’s new Singularity XDR Process Graph takes extended detection and response to the next level with consolidated telemetry that transforms disjointed data into insights and valuble visual indicators.
With SentinelOne Singularity and deep analytics applied across billions of disjointed and siloed data elements, Process Graph empowers threat analysts to understand and triage malicious and suspicious activity faster than ever before.
To learn more about how SentinelOne Singularity and the new Process Graph can empower your security operations, contact us or request a free demo.

