
Cloudera, the company that supports distributions of Apache Hadoop and Spark, created the HTrace tracing framework for Java. While they retired the framework last year, its many legacy projects still use it. It offers specific features that lend themselves to use with distributed systems. And it works with Kafka, Apache Flume, and Zipkin.
If you’re just a beginner at HTrace, don’t worry! Today, we’ll talk about how to get started with HTrace, and even those with no experience will be able to follow along.

Project Setup
To use the HTrace API in your code, you need to import the core API jars. Here’s the Maven dependency for the core library.
<dependency>
  <groupId>org.apache.htrace</groupId>
  <artifactId>htrace-core4</artifactId>
  <version>4.2.0-incubating</version>
</dependency>
We’re going to publish traces to a Zipkin server, so you’ll need the Zipkin library too.
<dependency>
  <groupId>org.apache.htrace</groupId>
  <artifactId>htrace-zipkin</artifactId>
  <version>4.2.0-incubating</version>
</dependency>
HTrace Terminology
Before we start, you need to understand a few HTrace concepts and terms.
Span
The basic unit of measure in HTrace is the span. A span is the length of time required to complete an operation.
A span has a beginning time, end time, and a description.
Scope
TraceScopes manage the lifespan of spans. When you create a TraceScope, it comes with a span object. When you close it, HTrace closes the span and sends it to one or more receivers for processing.
Tracer
A tracer is your handle to the HTrace library. It creates scopes for you.
Sampler
Tracers contains samplers. When you create a new scope, the samplers decide whether it’ll have active spans.
Creating a Tracer
To add HTrace to your application, you have to create a tracer. In some ways, a tracer is like a logger in log4j. It’s your handle to the HTrace API, but a single process or library can have more than one. Each tracer has its context and configuration.
Configuring a Tracer
HTraceConfiguration is a class with two abstract methods. If you implement them, you can create a configuration object.
public abstract class HTraceConfiguration {
    public abstract String get(String key);
    public abstract String get(String key, String defaultValue);
}
Depending on your needs, you can extend HTraceConfiguration to retrieve properties from an existing configuration store.
The API also offers an easy way to build a configuration from a map.
Map<String, String> properties = new HashMap<>();
properties.put("span.receiver.classes", "org.apache.htrace.impl.ZipkinSpanReceiver;org.apache.htrace.core.LocalFileSpanReceiver;org.apache.htrace.core.StandardOutSpanReceiver");
properties.put("sampler.classes", "org.apache.htrace.core.AlwaysSampler");
properties.put("local.file.span.receiver.path", "./traces/output.trc");
HTraceConfiguration conf = HTraceConfiguration.fromMap(properties)
So, you create a map if strings set the properties you need and pass it to HTraceConfiguration‘s static fromMap() method. You’ll use this mechanism for the tutorial.
Creating a Sampler
If you tried to trace every operation in a large application, you could end up with too much data. Storing it would be difficult, and analyzing all of it might be impossible. So HTrace relies on samplers to decide when to trace.
When you create a tracer, you need to provide it with at least one sampler. You can do this via configuration or with the addSampler() method.
In the configuration sample above, we passed in the AlwaysSampler class:
properties.put("sampler.classes", "org.apache.htrace.core.AlwaysSampler");
The sampler.classes setting accepts a semicolon separated list of sampler class names. As its name implies, the AlwaysSampler will always tell the tracer to create a span.
HTrace offers several predefined samplers. The CountSampler enables sampling each N times it is called. You configure the count with the sampler.frequency setting. The NeverSampler disables all sampling. ProbabilitySampler will enable sampling for a percentage of the times it’s called. Use sampler.fraction to set the threshold.
Adding Span Receivers
When you close a span, HTrace sends to one or more receivers. We added a list of receivers in the sample configuration above with the span.receiver.classes property.
properties.put("span.receiver.classes", "org.apache.htrace.impl.ZipkinSpanReceiver;org.apache.htrace.core.LocalFileSpanReceiver;org.apache.htrace.core.StandardOutSpanReceiver");Similar to samplers, HTrace provides a predefined set of receivers.
The LocalFileSpanReceiver writes JSON spans to a text file. Specify the fully-qualified filename with local.file.span.receiver.path. StandardOutSpanReceiver prints JSON spans to standard output.
Creating a Tracer
Now, you finally know enough to create a tracer.
First, create a configuration object. Start with a map, and add properties for an AlwaysSampler and a StandardOutSpanReceiver.
Map<String, String> properties = new HashMap<>();
properties.put("span.receiver.classes", "org.apache.htrace.core.StandardOutSpanReceiver");
properties.put("sampler.classes", "org.apache.htrace.core.AlwaysSampler");
properties.put("local.file.span.receiver.path", "./traces/output.trc");
HTraceConfiguration hTraceConfiguration = HTraceConfiguration.fromMap(properties);
Next, use the Tracer Builder class to create a tracer.
Tracer tracer = new Tracer.Builder("Widget Tracer").conf(hTraceConfiguration).build();
Finally, create a top-level scope.
TraceScope topScope = tracer.newScope("Parent Scope");
The tracer needs a parent scope for the scopes you’ll create as you trace operations.
You have a working tracer. Let’s put it to use!
Create a TraceScope
The easiest way to trace an operation is to wrap it in a TraceScope. When you create a new TraceScope, the tracer provides it with a new span. So the span times any activities that occur inside the lifespan of the scope.
It’s critical that you properly close the scope so HTrace publishes the traces. Fortunately, you can use Java’s try-with-resources pattern to make sure.
try(TraceScope newScope = tracer.newScope("Do something!")) {
    Thread.sleep(500);
}
Run this with the tracer created above, and the standard output SpanReceiver will print a trace to the terminal.
{"a":"701c95ae53b913e1b0d63378fc8526c9","b":1561937858888,"e":1561937859393,"d":"Do something","r":"Widget Tracer/10.211.55.2","p":["701c95ae53b913e12d43ce3cc0ff5145"]}
This JSON format isn’t very user-friendly. Here are the fields:
a: span ID
b: start time
e: stop time
d: description
r: tracer ID
p: parent ID
Let’s set up a new SpanReceiver to publish to Zipkin for a better view of your traces.
View Traces With Zipkin
Set up Zipkin
We covered Zipkin in a previous post. You can find instructions for setting it up with Docker there or follow the quickstart instructions here.
Set up a ZipkinSpanReceiver
If you already added the Zipkin jars to Maven, you only need to add the SpanReceiver to your configuration.
properties.put("span.receiver.classes", "org.apache.htrace.impl.ZipkinSpanReceiver;org.apache.htrace.core.StandardOutSpanReceiver");
By default, ZipkinSpanReceiver publishes traces to localhost at port 9410. But if you’re running Zipkin on another host, you can override the settings with zipkin.scribe.hostname and zipkin.scribe.port.
properties.put("zipkin.scribe.hostname", "192.9.200.2");
properties.put("zipkin.scribe.port", "8011");
After you added the new SpanReceiver to the config, rerun your application.
View a Trace in Zipkin
After you’ve generated a trace, go to the Zipkin main page. Your tracer name will be listed as a service.
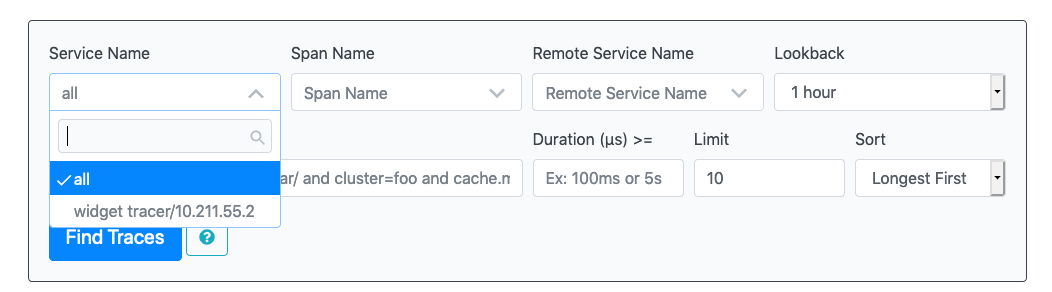
Select the service and click Find Traces.
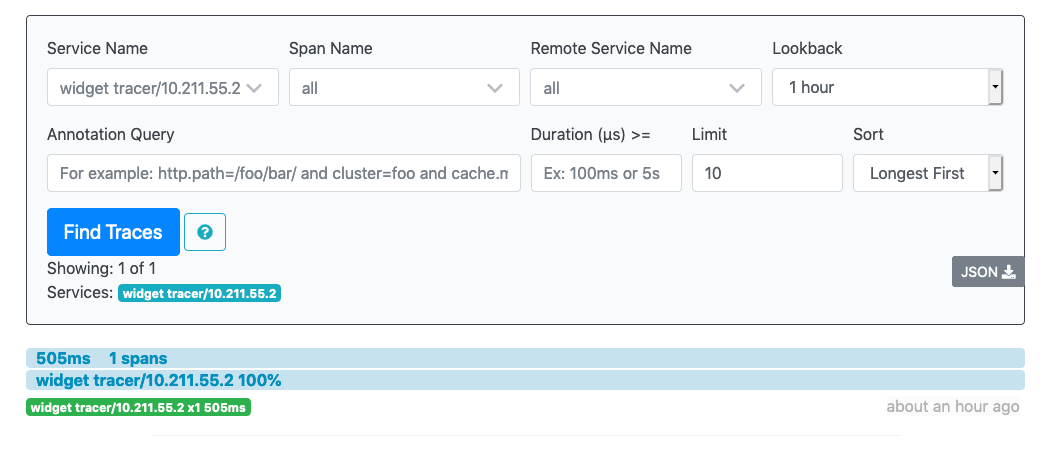
You’ll see your trace in the search results. Click on it.
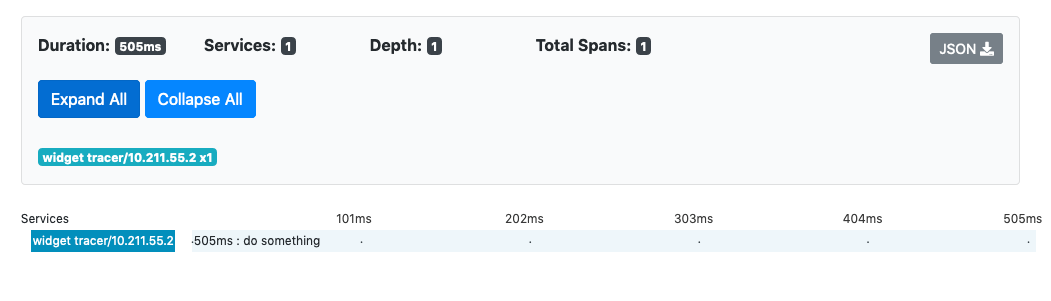
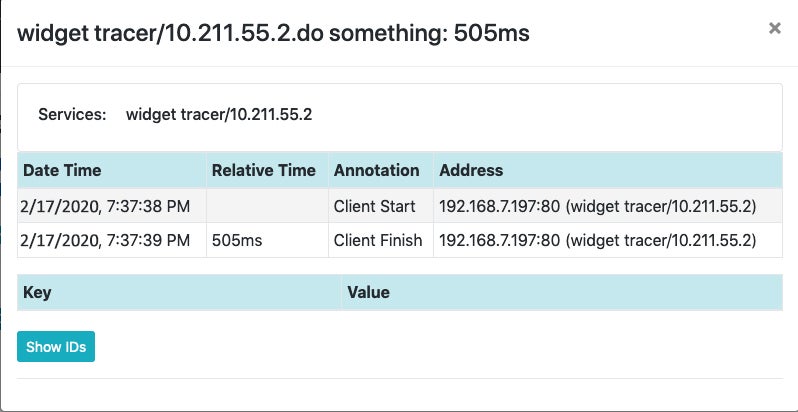
There’s your trace! Click on the name for a detailed view.
Wrappers and ExecutorServices
Wrapping an operation in a try block is convenient, but HTrace offers a few more options for tracing your code.
Let’s wrap our task in a Runnable object and wrap it inside a thread.
private static Runnable theTask(String spanId, String traceId) {

    return new Runnable(){
        @Override
        public void run(){
            try {
                Thread.sleep(1000);
            } catch (Exception e) {
                System.err.println("Caught exception in task");
            }
        }
    };
}
Wrap a Thread
A thread wrapper with tracer’s wrap method will be timed in its span.
Thread t1 = new Thread(tracer.wrap(theTask(), "Round 1"));
t1.run();
Use an ExecutorService
For more advanced threading and timing situations, HTrace will work with an ExecutorService. Create the service with your tracer:
ExecutorService executorService = tracer.newTraceExecutorService(Executors.newFixedThreadPool(10), "Round 2");
Pass newTraceExecutorService an Executor and an optional TraceScope name. Here, the service will have a pool of 10 threads.
Then, pass your task in to execute, which returns a Future. In this example, the code blocks until the task completes. You can use the Future for advanced threading operations.
executorService.submit(theTask(tracer.getTracerId(), topScope.getSpanId().toString())).get();
An ExecutorService is a powerful tool for managing tasks and threads.
Create Related Traces
So let’s put it all together.
Tracer tracer = new Tracer.Builder("Widget Tracer").conf(HTraceConfiguration.fromMap(properties)).build();
TraceScope topScope = tracer.newScope("Parent Scope");

Thread t1 = new Thread(tracer.wrap(theTask(), "Round 1"));
t1.run();

ExecutorService executorService = tracer.newTraceExecutorService(Executors.newFixedThreadPool(10), "Round 2");
executorService.submit(theTask()).get();

try(TraceScope newScope = tracer.newScope("Do something!")) {
    Thread.sleep(500);
}
tracer.close();
Run this code and check Zipkin.

Zipkin shows the three spans we created. Click on them and see how Zipkin graphs them.
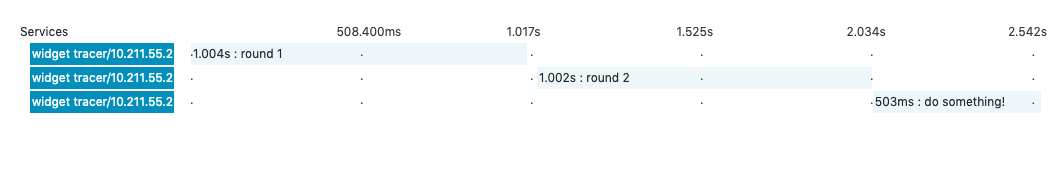
Zipkin show each of the spans in the order they were executed. It displays each one with its unique scope name.
Distributed Tracing
We’ve covered tracing inside a single process. Now, how do we trace a distributed operation?
You gave each of the scopes above a unique name, but you don’t have to. Imagine a system where you passed a shared scope name to each scope. We can simulate this with a small code change.
String scopeName = "Child Scope";

Thread t1 = new Thread(tracer.wrap(theTask(), scopeName));
t1.run();

ExecutorService executorService = tracer.newTraceExecutorService(Executors.newFixedThreadPool(10), scopeName);
executorService.submit(theTask()).get();

try(TraceScope newScope = tracer.newScope(scopeName)) {
    Thread.sleep(500);
}
tracer.close();
Run this and then look at the latest entry in Zipkin.
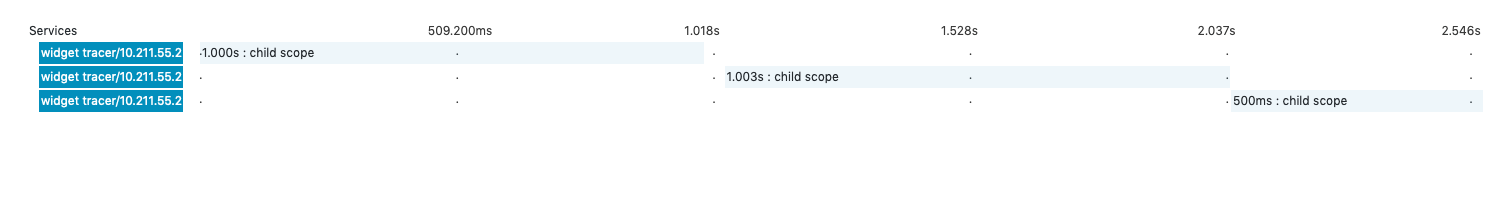
Zipkin displays the spans in order, but they share a single scope name now. Even if they were reported by different processes, they would be displayed together.
Distributed Tracing With HTrace
Tracing is a powerful way to follow your program’s execution. Distributed tracing takes it up a notch, correlating tasks across process and even network boundaries. You can save hours of troubleshooting with a distributed tracing framework instead of trying to coordinate the data on your own.
Additionally, if you’re interested in more articles related not only to tracing but on a variety of monitoring-related topics, keep in touch with the Scalyr blog. We’re always publishing more of those. While you’re at it, try Scalyr’s offering, which is a complete log management solution for modern engineering and operation teams, just like yours.

