
So, you’ve got a serverless function and you want to know how to use logging effectively. Serverless systems require a unique approach when it comes to operation and monitoring. And that unique approach is exactly what we’re going to cover today.
This post is all about serverless logging. We’ll cover why and how serverless logging differs from traditional applications. We’ll then go on to talk about techniques to get the most value possible from our logs.
Sound good? Let’s dive in.

Why Log in the First Place?
Firstly, let’s briefly touch on what logging is. It’s important that we get on the same page because this will lead us through our later discussions.
Logging is the process of emitting data entries about the current status of the application we’re running. When we’ve got our hands on this data, we can use it to derive insights about how our application is working (or not). We can also use our log entries to debug issues with our running applications if we have an outage or incident.
In some cases, logs are added for us automatically depending on the tool or technology we use. But in most cases, logging requires that we diligently go through our applications and instrument them with the data we require. Logging is as much an art as it is a science. We need to know our applications inside out to emit the correct data that can be used in the future when we’re debugging and assessing our system.
OK, that covers what logging is from a 10,000 foot view. Now let’s start getting more into the details of logging when we’re in a serverless world. We’ll start by assessing the differences in serverless logging and traditional applications.
Serverless Logging vs. Traditional Application Logging
For logs to be of any use, they need to be extracted from our application and sent to some location. Preferably, they would be aggregated into a central location so that we can see information about all our running services in a single place. Use Scalyr’s trial to aggregate logs.
So, how did we log? When we have a server environment, logs might find their way to our logging system via an agent. A logging agent is usually installed on our host, and it grabs our locally logged files before streaming them to some remote location. However, when we’re in a serverless world, we can’t simply install an agent, because we don’t have access to the host.
So how can we get logs from our serverless application? There are two methods.
The Two Serverless Logging Methods
When it comes to serverless, you’ve got two broad methods to choose from. Both methods have individual trade-offs. Neither method is strictly recommended, as it depends on your situation—what exactly it depends on, we’ll discuss in just a moment.
Synchronous Logging
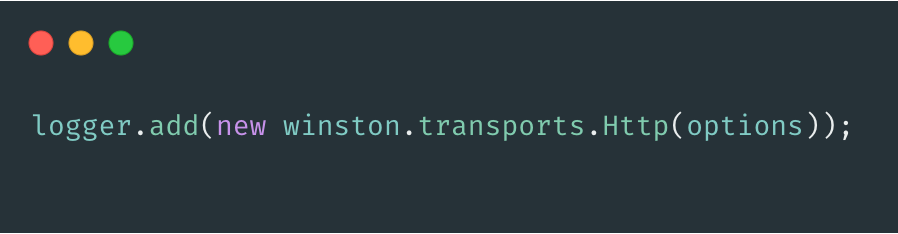
The first method of logging in serverless is via synchronous logging. With synchronous logs, we send logs to a logging system while our serverless compute is currently running (or at completion). We can do this through a logging library or service. And, typically, we send these logs over a synchronous method, such as HTTP, and wait for a response. Synchronous logging can be easy to implement, and how it works is fairly transparent.
But there are a few downsides, such as network latency being pushed onto the user’s side. If the log takes a long time, this might have a user-facing impact. Not only do long-running synchronous logs affect users, but if they take too long to return, this may time out your serverless function, again causing errors to be sent to the user.
So, if you’re precious about response times, maybe you should look into async logging.

Asynchronous Logging
Alternatively, we can log asynchronously. Most cloud providers allow you to stream logs from your serverless functions into some persistent location. In AWS, for instance, when you log to stdout or stderr, logs are automatically shipped to CloudWatch via a log stream. Now with logs available in CloudWatch, we can begin to analyze and query our data. But, as with synchronous logging, there are downsides.
Cloud analytics tooling is usually pretty low in terms of features. Many companies look into additional tooling to help support their monitoring effort. This means you’re going to need to extract those logs and ship them to some other location for analysis (in AWS, this would be using a service like Kinesis).
What To Log When Using Serverless?
A common question when implementing logs is often: What should I log? Unfortunately to give a thorough response you really need to understand the application, to make an assessment of the likely failure points and notable information. However, there are some common logical areas to add log entries in most use scenarios, and these are:
- The serverless input event (the arguments to your function)
- The response value (if not sensitive or too large)
- Inputs and outputs to integrations with other services
- On try/catch or failure points
- Time to execute for the entire serverless function
- Time to execute for integrations with other services
Start with these main areas, and then each time you revisit the application logs or find yourself without enough context to debug something, start to diligently add more logs or more detail where necessary.
Serverless Logging Best Practices
Now that we’ve talked about how to log and what to log, let’s take a look at some finer details we should apply to our serverless logs such as structuring, log levels and sampling.
Structure Your Log Values
A best practice for logging in Serverless is to structure the logged values. Rather than simply emitting logs as strings, you’d ensure each value is assigned a property. Structured logs are easer to parse logs within your tooling later. A common way to structure events is using the JSON data format.
So rather than emit logs as strings:
Function response: 200
Function execution time: 4 seconds
You emit them in a structured format:
"{ "executionTime": 4 }"
"{ "response": 200, "executionTime": 4 }"
To add structure to your logs you may want to implement a utility function to wrap your log emit entry in order to apply your structure, i.e serialising the log JSON.
Use Log Levels
Log levels are an extra attribute added to each log entry. Typically log levels follow a scale which determines how verbose the log entries are. A typical scale is fatal, error, warn, info, debug, trace.
Each log level would then emit details according to the required verbosity configured for the service. To configure a Serverless function you can set an environment variable which represents your desired log level.
"{ "level: "INFO", "response": 200 }"
Apply Correlation IDs to Logs
Once we store our logs, we might start to notice a problem: all of our different services are logging slightly different formats or information. And now trying to work across multiple services is becoming a pain. As these services start to diverge, we’ll want to try to bring our logs back together using a common standard format and a special tool known as the correlation ID.
But what is a correlation ID? A correlation ID is a unique ID that is given to each transaction that flows through our system. Because serverless architectures are distributed by default, that means we’ll want to see where in a potential flow our request is failing.
And we can achieve request correlation in three steps:
- Firstly, by shipping logs to the same central location
- Secondly, by ensuring that our logs have a machine-readable data format (such as JSON)
- Thirdly, by ensuring that each service is appending a correlation ID
Sample Logs to Reduce Cost and Noise
Now that you’re really excited about logging, and you’ve instrumented all of your services with gratuitous amounts of logging, you’ll soon realize that logging isn’t free. In fact, logging and application monitoring can be one of the biggest expenses of a serverless application.
So what’s the solution to high-volume logs that are starting to get expensive? The answer—sampling.
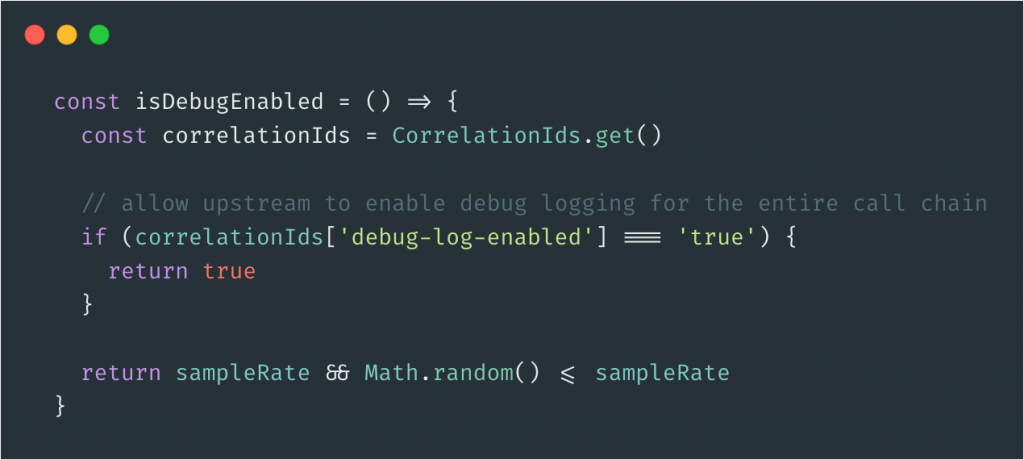
By sampling our serverless logs, we’re storing only a certain amount of them at a time and simply dropping the rest. We can sample based on many factors, but a simple method would be to set a percentage and log only that amount of requests. Sampling has the effect of significantly lowering cost without compromising on data richness.

Getting Value From Your Logs
Let’s imagine that we’ve discussed with our team how we’re going to extract our logs. What are the best practices we should now apply to get the most out of our newly stored logs? Let’s take a look.
Set up Alarms Based on Logs
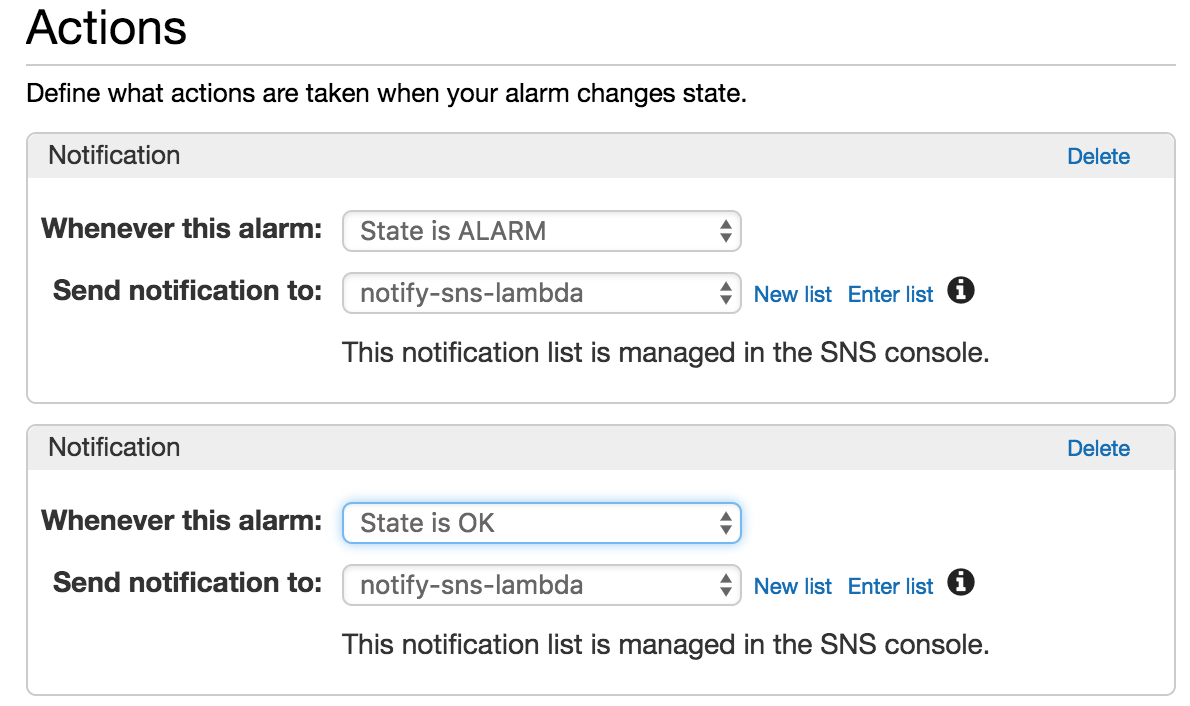
Logs are useless if we don’t take action from them. One key way to get big value from your serverless logs is by setting up alarms. Alarm thresholds can be set that will alert engineers if our application is doing something unexpected.
Alarms can be set using logs. For instance, when a higher (or lower) number of invocations occurs, a higher request latency occurs, or a higher frequency of errors occurs than expected. All of these examples can be set up using logs and carefully refined over time, diligently modifying the alarms so they deliver the most value. Experiment by setting up alarms using Scalyr.
Visualize Log Output
The main task that computers are best at is churning through data quickly and repeatedly. And the thing that humans are best at is spotting patterns in data. To be able to spot patterns in our data, we’ll need some tool to visualize our logs. If you’re working in AWS, you can use native tools like AWS Log Insights to query and map your logs onto visualizations, but the service can be limited.
So, if you really want to up your game, I’d suggest you invest in a third-party dedicated service such as Scalyr to powerfully visualize your logs. Setup log visualisations with Scalyr.
Log It All!
And that’s a wrap for today. We’ve discussed some of the difficulties of serverless logging, such as whether to log asynchronously or synchronously, and some further considerations for when you’re logging in a serverless world. Hopefully, you can implement some of the ideas we’ve discussed today, such as alarms, correlation IDs, and visualizations, to really bring life to your logged data!

