
Last month, we fixed a pile of bugs and added two of our most highly requested features. If you’re curious about which bugs we fixed, we list them in our weekly release notes at https://www.scalyr.com/releasenotes/.
Tabular Search Results
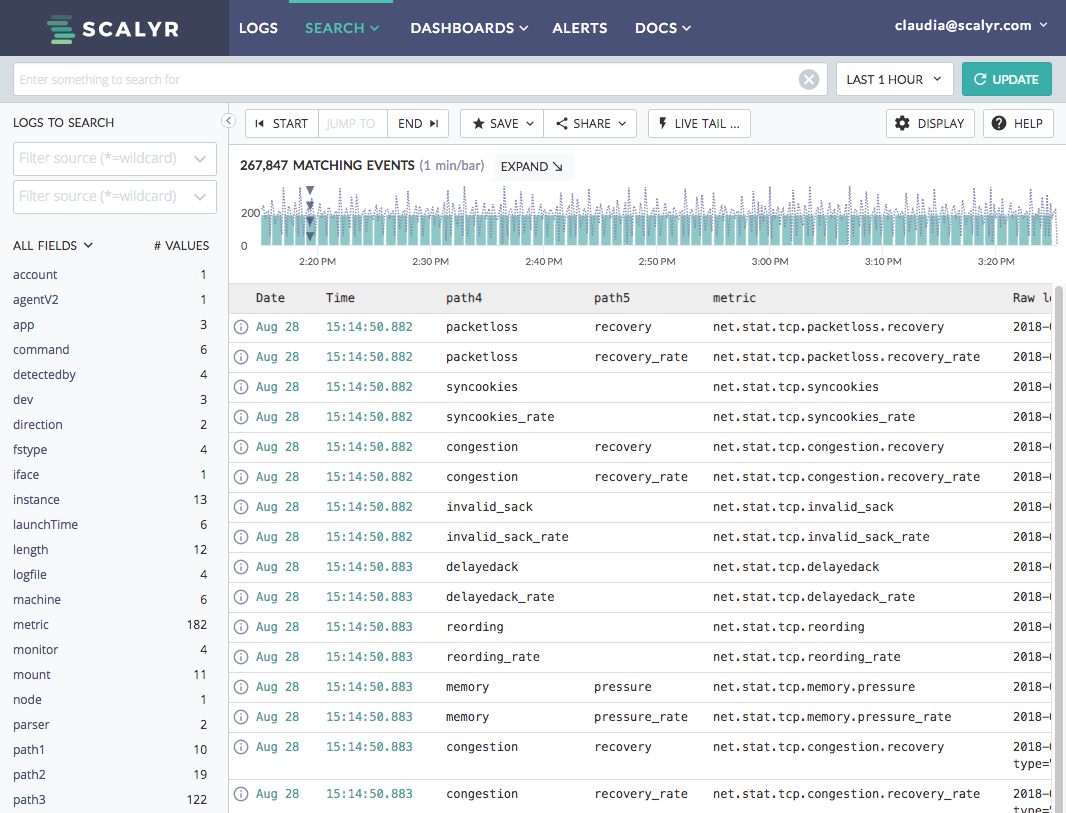
In addition to our standard side-scrolling log search results, we’ve added a new table view mode. If you’re searching through fairly heterogeneous logs, having the just the field values shown in columns makes it much easier to see patterns and find things.
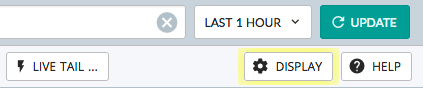
To try table mode, just bring up the Display Settings dialog, and choose the table radio button under “Display log entries in…”. You can pick what to show as columns from the list of parsed fields plus from the system fields checkboxes.
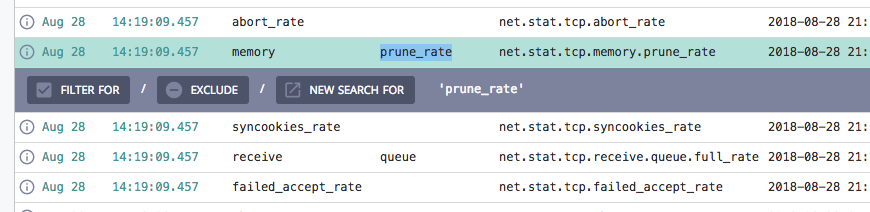
Another nice benefit in using a table is that you can be more exact when filtering. In the screenshot above, I’ve used the mouse to select the ‘prune_rate’ value for the ‘path5’ field. If I click the FILTER FOR button, the query becomes “path5 contains ‘prune_rate‘”, instead of just “prune_rate”.
Log Lines in Alert Emails
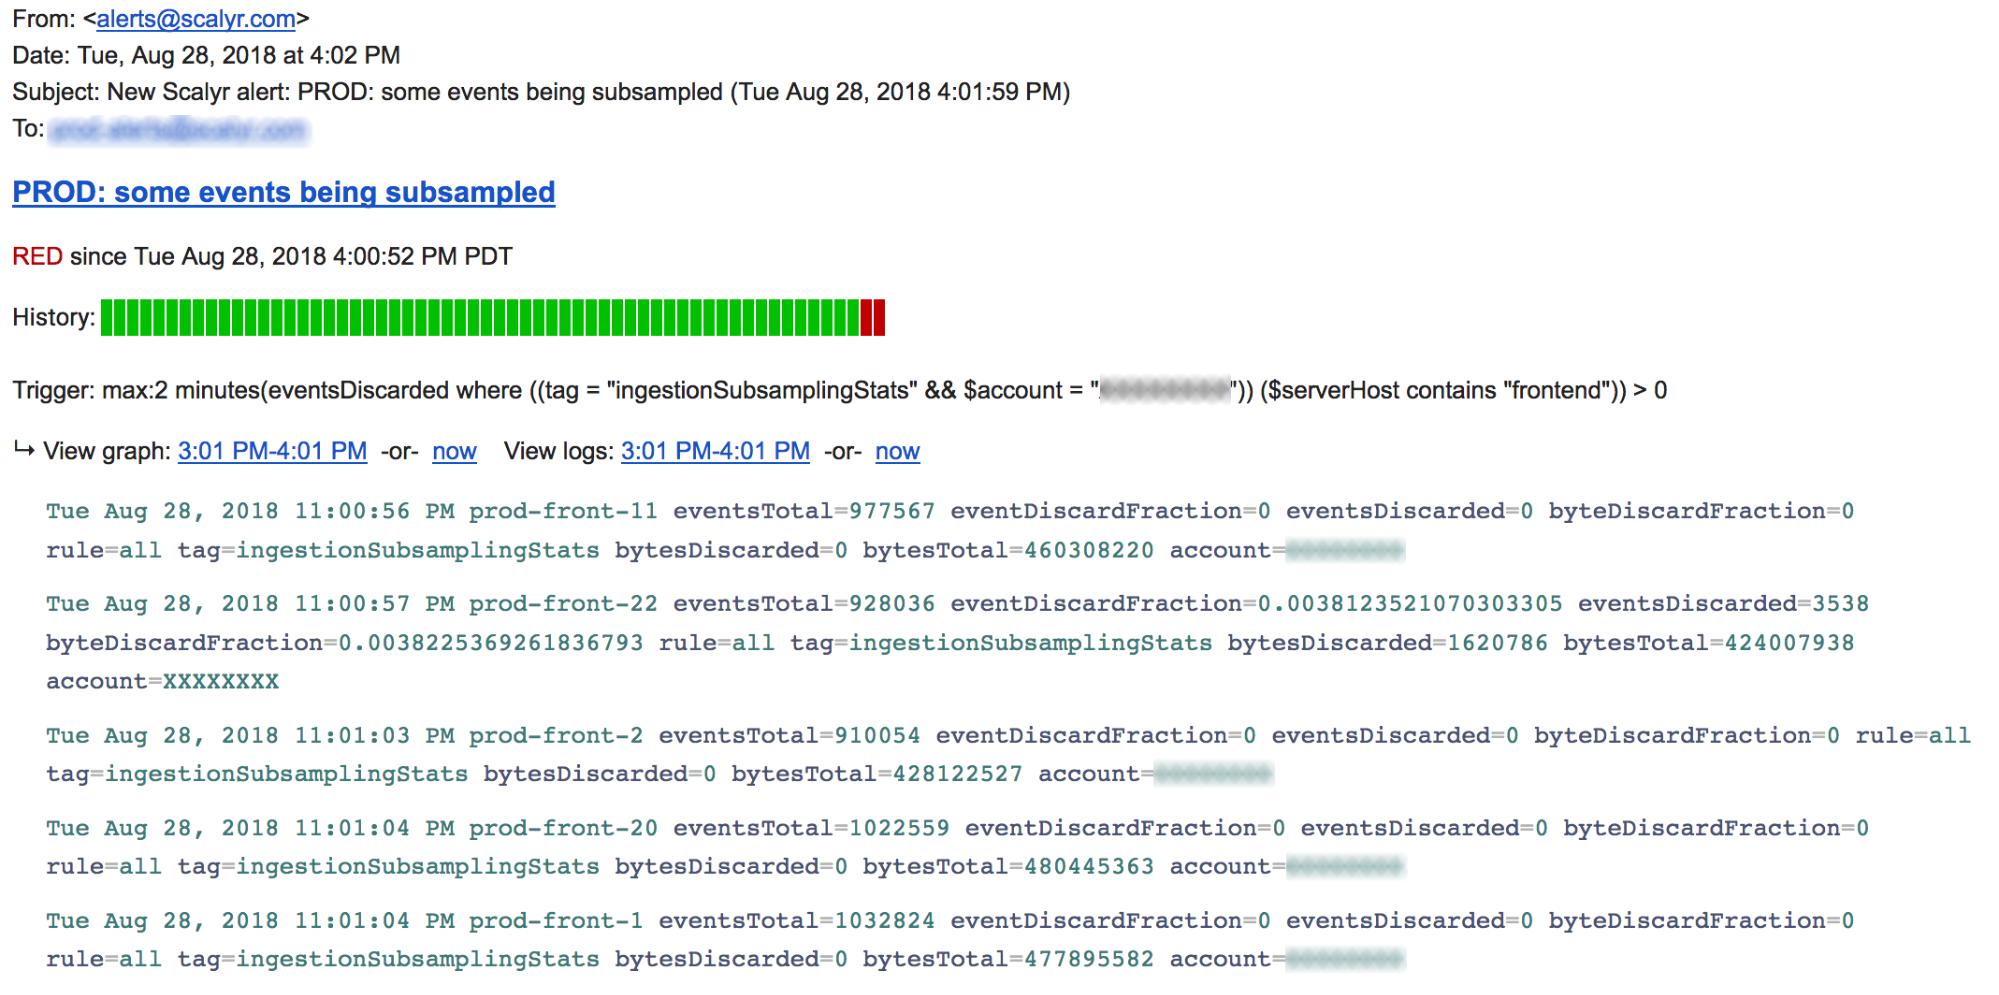
Usually it’s easier to spot problems when you can see a visual trend, especially when you’ve got obvious spikes in a timeline or dashboard graph. There are other times, though, when one glance at a terribly familiar log line can tell the tale even better.
Raw log lines are so verbose that we’re not turning them on for everyone, but you can request them by dropping us an email at [email protected].
Obscured API Keys
For security or compliance purposes, you may be required to keep your API keys hidden from view in Scalyr. We’ve added the ability to only show them when you create them, but keep them obfuscated on the client thereafter.
If you would like to turn this setting on, email us at [email protected].
Feedback
Got an idea, feedback or questions? Email us at [email protected].

