Metrics can be an incredibly powerful tool for running your software. The combination of Prometheus and Grafana continue to stand out as great, low-cost options to plug this power into new and existing applications. Both are free to use.
- Prometheus is a condensed way to store time-series metrics.
- Grafana provides a flexible and visually pleasing interface to view graphs of your metrics stored in Prometheus.
Together they let you store large amounts of metrics that you can slice and break down to see how your system is behaving. They also have a strong community around them to help deal with any usage and setup issues. However, each has many moving parts if you want to use them effectively, and that can seem like a roadblock.
This article will help you remove this roadblock. You’ll get a high-level view of how both Prometheus and Grafana work with your application. Then you’ll zoom into each part and find out how easy it can be to set it up. You’ll also learn about the next steps you might take to use these tools.
Let’s use the open-source framework Spring Boot as a sample app. Spring Boot is a framework that lets you quickly build Java applications.

Overview
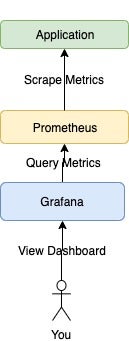
As you can see, Prometheus and Grafana monitoring has three main parts. Prometheus acts as storage and a polling consumer for the time-series data your app produces. Grafana queries Prometheus to give you informative (and very pretty) graphs. Later on you’ll zoom in to each of these parts to understand how they work together.
Application
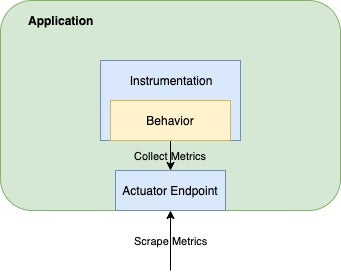
Your application is where things will differ the most from this tutorial. How you instrument the metrics in your app depends mostly on your app’s makeup: its language, framework, and the client library you choose. Fortunately, Prometheus has a variety of client libraries for the most popular languages. It also has detailed documentation on how to instrument your app with them.
For this tutorial, we’ll use Spring Boot and the programming language Kotlin. It’s simple to instrument a Spring Boot app. If you just want to play around with Prometheus and Grafana, I recommend following this part of the tutorial and getting it set up in Spring Boot as well. If you’re using a different language, I recommend looking at the Prometheus client library docs.
Instrumentation
We’re using Spring Boot 2 as our sample app. Spring Boot 2 has a built-in metrics collector called Micrometer that makes it easy to plug in Prometheus. First, we add the Gradle dependency:
dependencies {
	implementation("org.springframework.boot:spring-boot-starter-actuator")
	implementation("io.micrometer:micrometer-registry-prometheus")
}
This will automatically start collecting metrics for every HTTP request in your application. (If you need to know the basics of Gradle dependencies, check out this link.)
Actuator Endpoint
Notice you also added spring-boot-starter-actuator in the code above. Doing this lets the client library expose an endpoint for all the metrics you collect, even custom ones.
To ensure this metric is visible, add this line to your application.yml:
management.endpoints.web.exposure.include=prometheus
Verification

With all that in place, it’s time to verify that you’re up and running. Go to localhost:8080/actuator:
If you go to the Prometheus link, you should see something like this:

Much of this is customizable, but this is enough to get started.
Now, let’s discuss why Prometheus is useful.
Prometheus
The innards of Prometheus aren’t that exciting. It’s enough to know that Prometheus excels at storing time-series data. It stores this data by dimensions. For example, it can store data categorized by endpoint, customer ID, region, preferred status, and other categories—all at the same time, for any given metric. The more dimensions you have, the more Prometheus can slice up your data. Adding such dimensions depends on which client library you’re using.
Downloading
There are at least two paths you can take to setting up Prometheus: Docker and downloading directly.
To get Prometheus production-ready, I highly recommend treating it like code and containerizing using Kubernetes or Docker directly.
For this tutorial, I downloaded it directly and unzipped it.
Configuration
Once you have Prometheus installed, you’ll want to change its configuration to point to your application. Prometheus uses good ol’ HTTP out of the box to scrape metrics. All you need to do is tell it where to look. Prometheus’ configuration is controlled through its prometheus.yml file, which you can find in its root directory:
# my global config
global:
  scrape_interval:     15s # Set the scrape interval to every 15 seconds. Default is every 1 minute.
  evaluation_interval: 15s # Evaluate rules every 15 seconds. The default is every 1 minute.
  # scrape_timeout is set to the global default (10s).

# Alertmanager configuration
alerting:
  alertmanagers:
  - static_configs:
    - targets:
      # - alertmanager:9093

# Load rules once and periodically evaluate them according to the global 'evaluation_interval'.
rule_files:
  # - "first_rules.yml"
  # - "second_rules.yml"

# A scrape configuration containing exactly one endpoint to scrape:
# Here it's Prometheus itself.
scrape_configs:
  # The job name is added as a label `job=<job_name>` to any timeseries scraped from this config.
  - job_name: 'prometheus'

    # metrics_path defaults to '/metrics'
    # scheme defaults to 'http'.

    static_configs:
    - targets: ['localhost:9090']

  - job_name: 'spring-actuator'
    metrics_path: '/actuator/prometheus'
    scrape_interval: 5s
    static_configs:
      - targets: ['localhost:8080']
Most of this is the default configuration, but hone in on the job_name: ‘spring-actuator’ at the end. This is where you tell it to look at your application. This basically says, “Go to localhost on port 8080, and every five seconds, query ‘/actuator/prometheus’ for metrics.”
Note: In that first job, Prometheus also collects metrics about itself. The default port for Prometheus is 9090, and it scrapes itself for self-diagnostic metrics.
Verification
Once you edit the file and restart the service, you can see whether it’s working by going to the URL that hosts it. In this case, it’s localhost:9090. From there, go to the Status > Targets menu item:
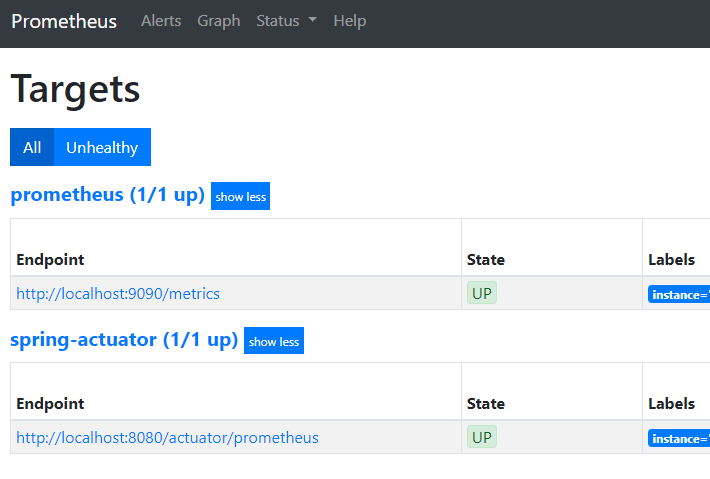
If the spring-actuator or whatever you called your app job shows up in the UP state, then it’s working!
You may be thinking, “Prometheus already has a user interface! Why do I need Grafana?” This is a fair question, but Prometheus’s UI is very limited. Grafana will give you a plethora of query, calculation, and visualization options that go far beyond this simple UI.

Security
When putting Prometheus into production, you’ll likely have some sort of security around your metrics endpoint. Fortunately, Prometheus supports multiple authentication mechanisms when scraping, including Basic and OAuth2.
Now let’s move on to Grafana.
Grafana
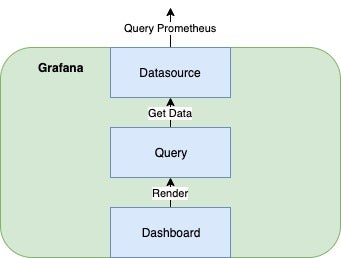
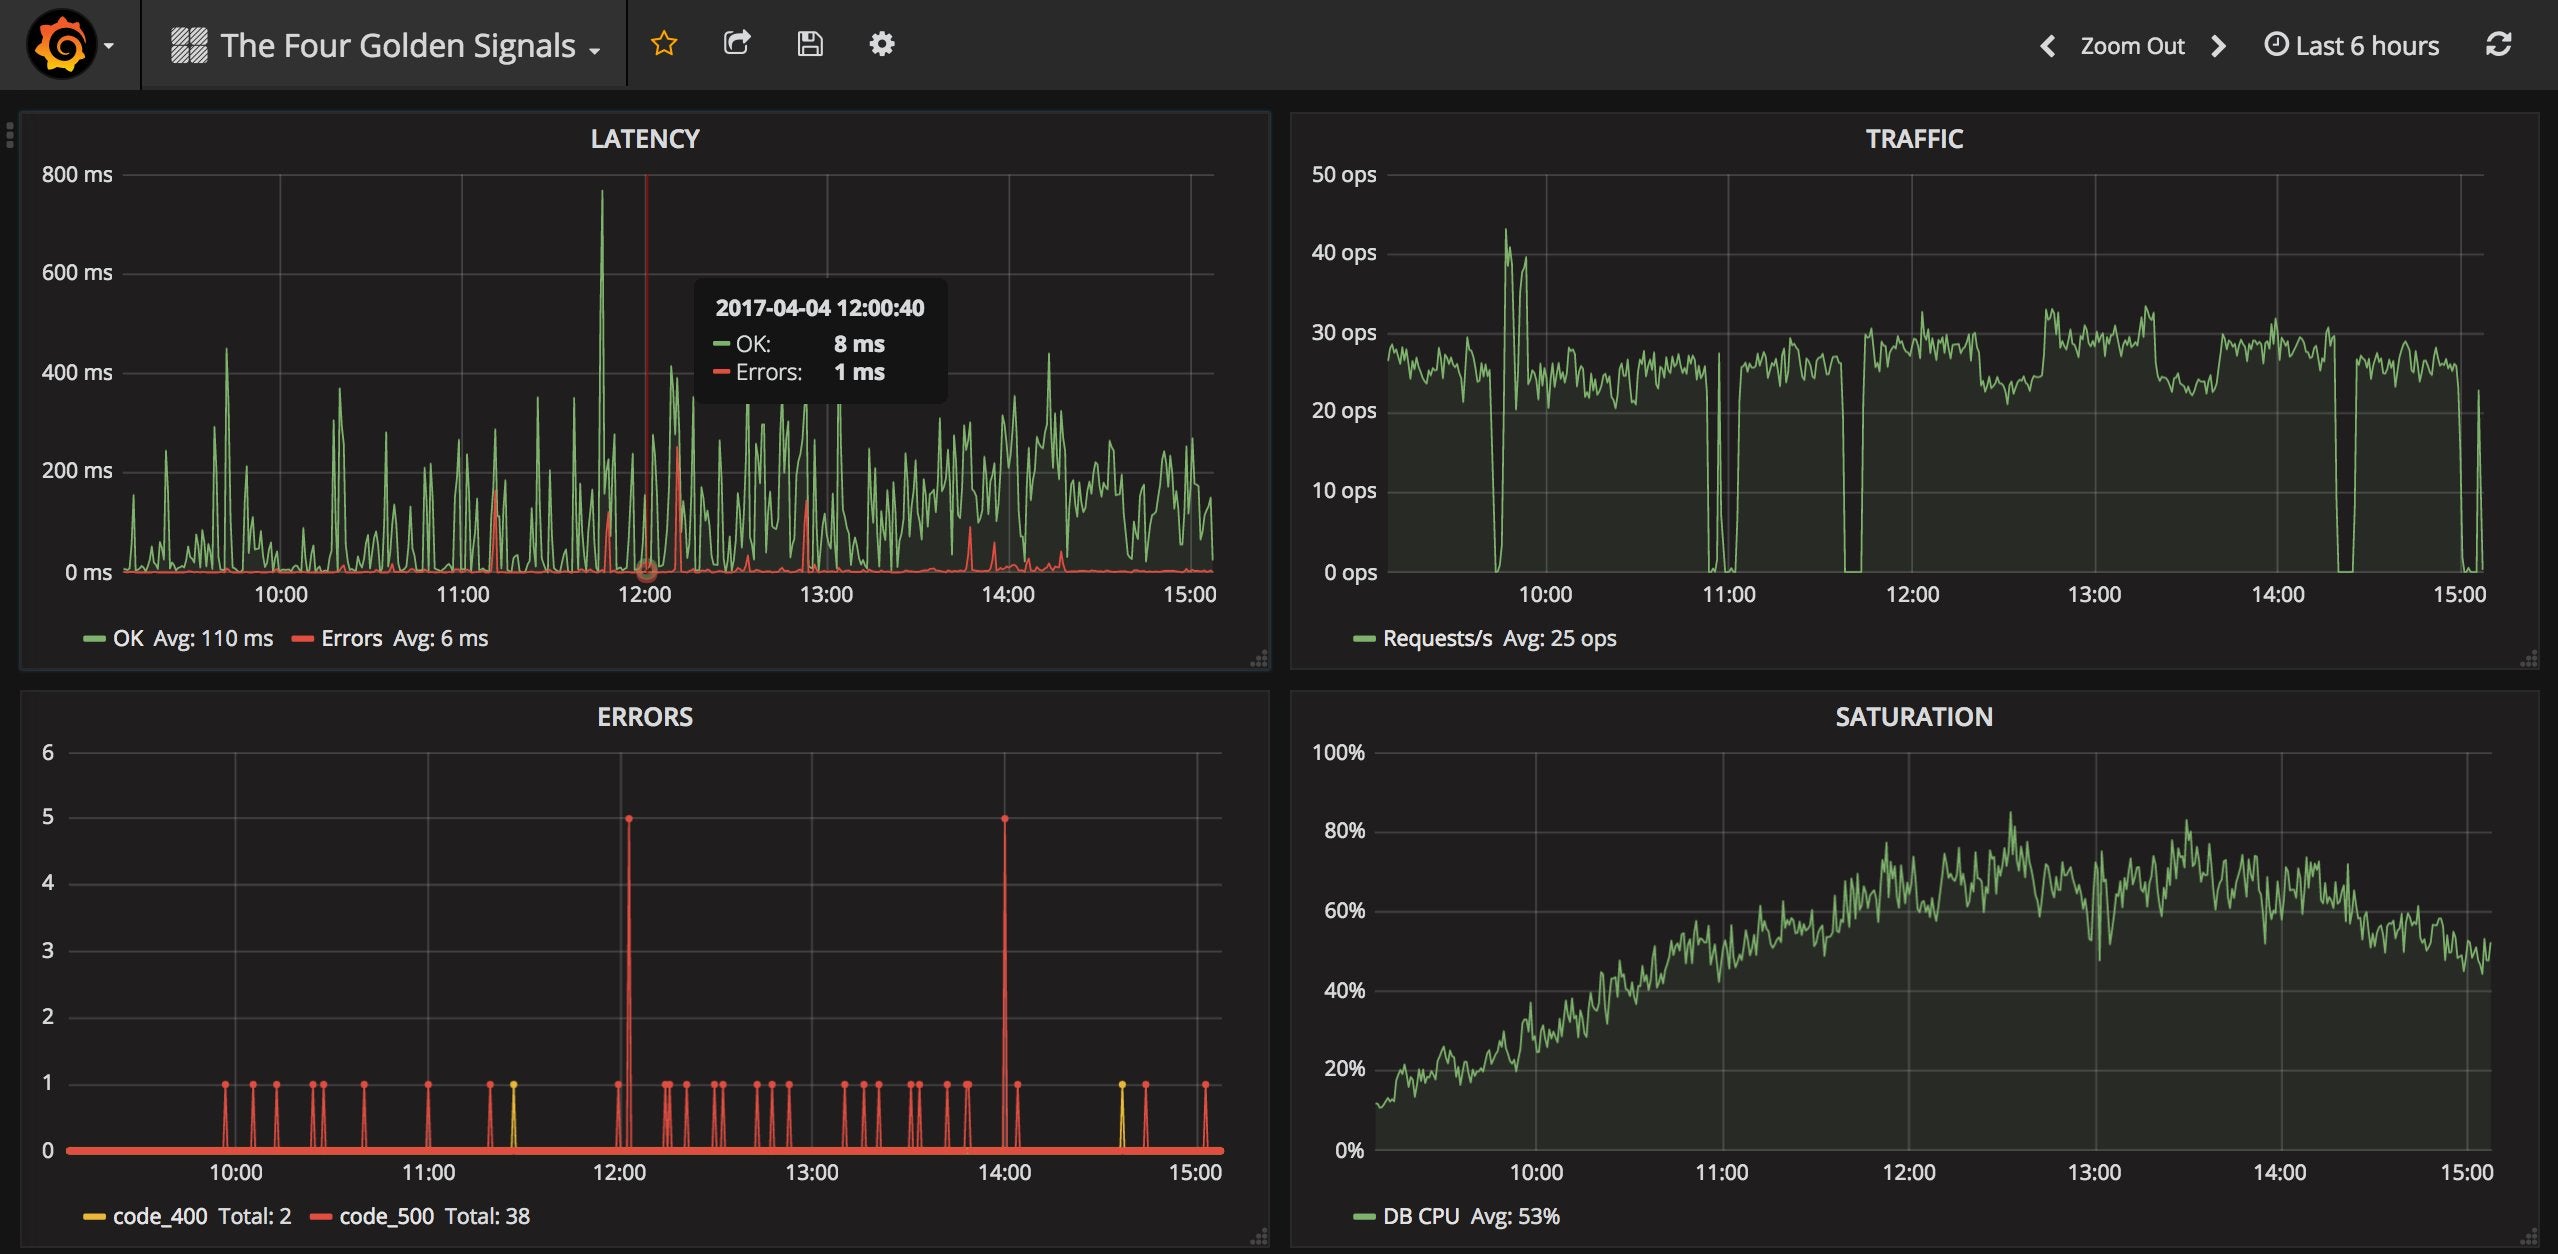
Grafana is a free, fantastic way to visualize time-series data. It works with a variety of backends, but one of its favorites is Prometheus. Here’s an example dashboard using the four golden signals of monitoring: latency, traffic, errors, and saturation.
Installing
You have at least three options to install Grafana: directly downloading an installer, using Docker, or having Grafana Labs host it directly.
The first two options are straightforward. I’d lean toward using the hosted solution if you have a budget and it complies with your organization’s policies. Using the hosted solution also lets you host a Prometheus instance as well. That saves quite a bit of maintenance!
Data Source
Before you can have amazing dashboards as shown above, you need to add your Prometheus service as a data source. First, log in. If you installed locally with defaults, the URL should be localhost:3000.
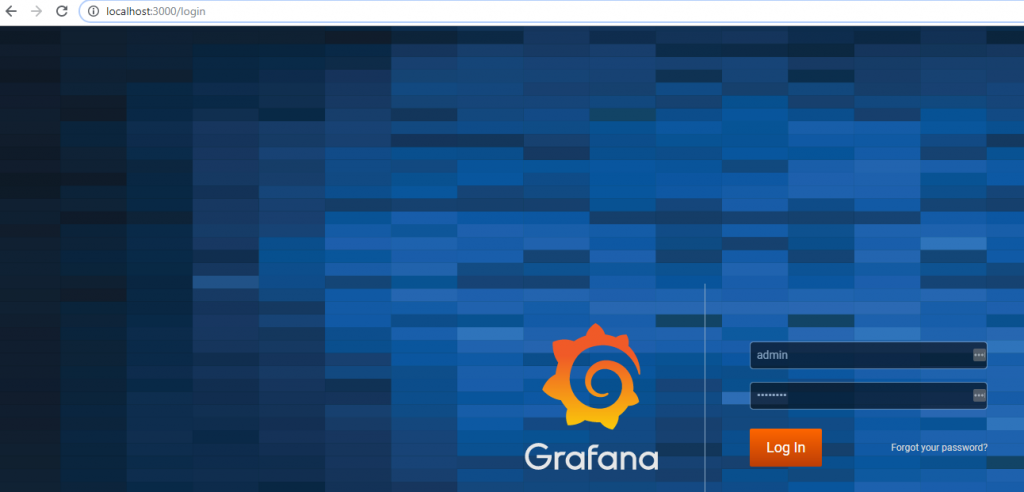
Then go to Configuration. Add a Prometheus data source pointing to the correct URL, which for me was http://localhost:9090.

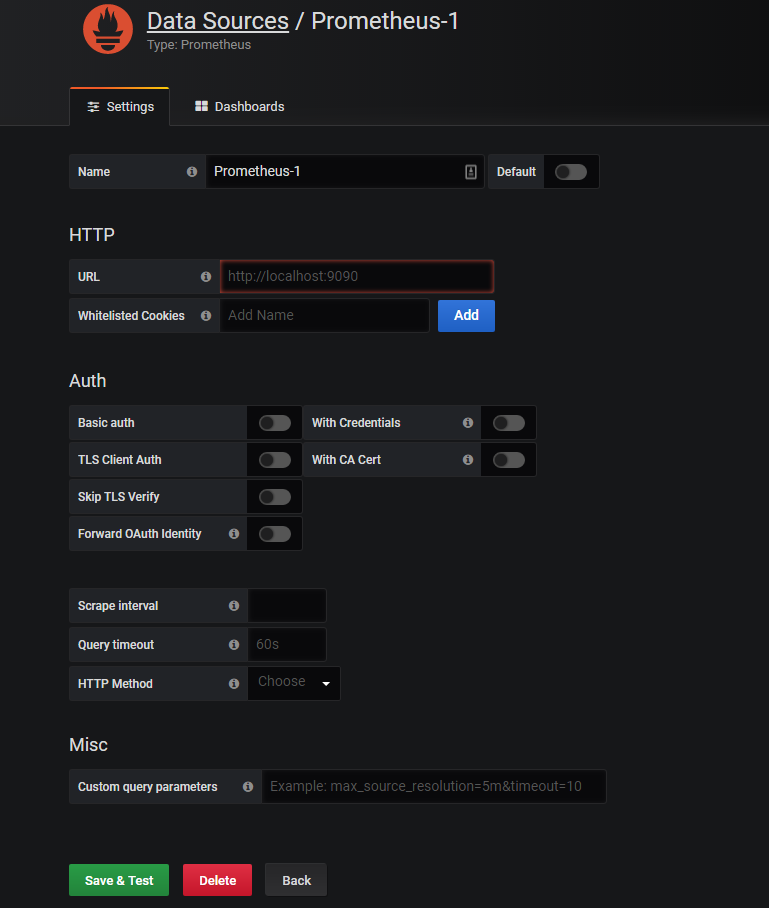
Note: Using the Save & Test option will verify that you can actually connect to the Prometheus instance. Also, note the variety of authentication options available for when you inevitably secure your Prometheus instance.
Dashboards and Queries
With your data source in place, you can freely add dashboards. From the Data Sources page, click the Dashboards tab.
To ensure everything is working, you can import the Prometheus 2.0 dashboard.

You can also make a new dashboard.
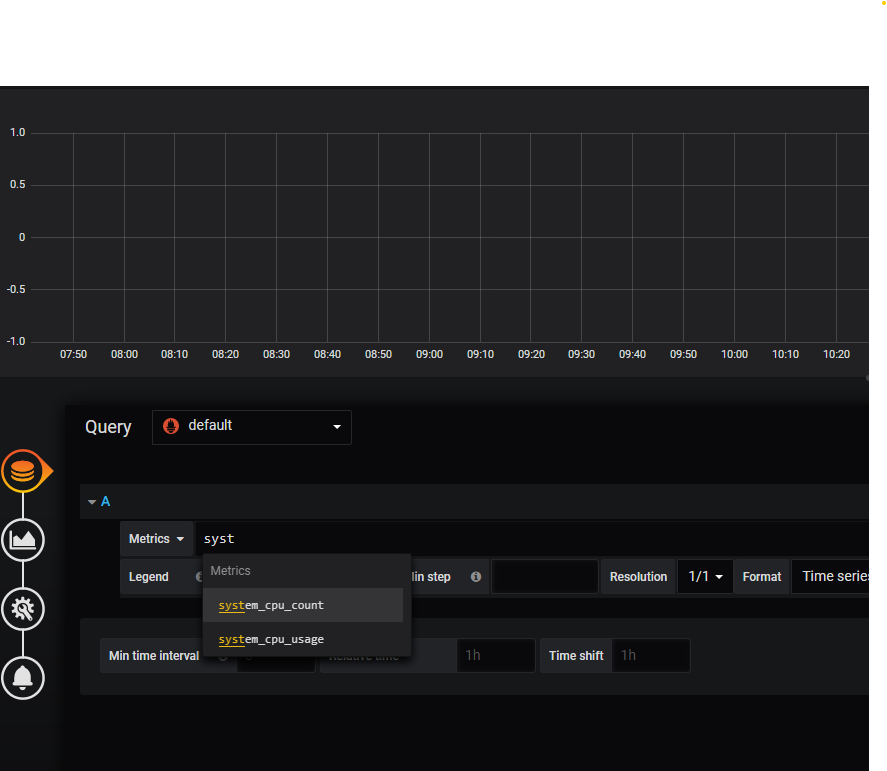
You’ll see the same metric labels from the /actuator/prometheus end point show up as options. You can slice and dice these metrics by using various dimensions. For example, this code:
system_cpu_count{instance='localhost:8080'}
will show CPU usage only for the Spring Boot app I spun up.
The art of querying and calculating metrics, like latency, is a whole topic in itself. You can go to grafana.com to look at various dashboards and find out how they query Prometheus data sources.

Beyond Getting Started
You can set up high-quality metrics for your own application using Prometheus and Grafana. Even if you’ve never added metrics before, these two components make a potent combination. The cost to set them up is low, but their value is immeasurable.

However, this tutorial just gets you started in setting up these tools. There’s a whole world of metric management to learn and explore. When you get your own instances of Prometheus and Grafana up and running, I recommend reading two more things. This article will help you design your first real Grafana dashboard. And this section of Prometheus’ documentation will help guide you to instrumenting your application effectively.
You can also use Grafana along with Scalyr’s log management solution, by leveraging its Grafana plugin. If you don’t already use Scalyr, why not give it a try?
Best of luck as you explore the world of Prometheus and Grafana.


