
You probably know that feeling when something is broken and you don’t know why. It might be a simple bug, but it also might be something more serious. That uncertainty can be frustrating and nerve-wracking. Thankfully, we can improve our situation with logs.
For any application you build, it’s important to ensure you have effective logging configured, regardless of the language or framework that you use. When you set your logs up properly, you can use them to quickly debug problems and monitor performance.
To help you get there, Scalyr created a series on logging with different techs. Some of the earlier articles in this series looked at the basics of getting started with logging in Python, Angular, and PHP. And in this article, I’m going to help you get started quickly with logging in Laravel.

What Is Laravel?
Before we get started with logging, let’s take a moment to talk about what Laravel actually is.
Laravel is a popular PHP framework that focuses on making the lives of developers as productive as possible (at least while coding). The creator of Laravel, Taylor Otwell, has worked hard to ensure that the syntax is clean and clear, allowing anyone who uses the framework to move from idea to solution as quickly as possible. The framework has excellent documentation and a strong, helpful developer community.
Like other features of the framework, logging in Laravel is expressive and easy to use—and it works straight out of the box. The services provided allow you log to local files, send an email, or even message your whole team in Slack. Also, Laravel leverages a powerful PHP logging library called Monolog, which provides powerful handlers for logs. You can use the developer-friendly configuration of Laravel to leverage these handlers and create a bespoke logging experience.
Getting Our Project Up and Running
Before you can get started with logging, you need to get a local version of Laravel up and running on your machine. There are full installation details on the Laravel website to help you do this, but let me share some advice here, too.
The smoothest way to install is first to set up PHP and Composer on your machine. Composer is the package manager for PHP, and if you’ve used npm for Node packages or pip for Python then this will be familiar. With Composer installed, you can install the Laravel installer globally as follows:
composer global require laravel/installer
Once you’ve installed the utility, you can use it to get your project up and running. For this article, I’m going to call my project logging.
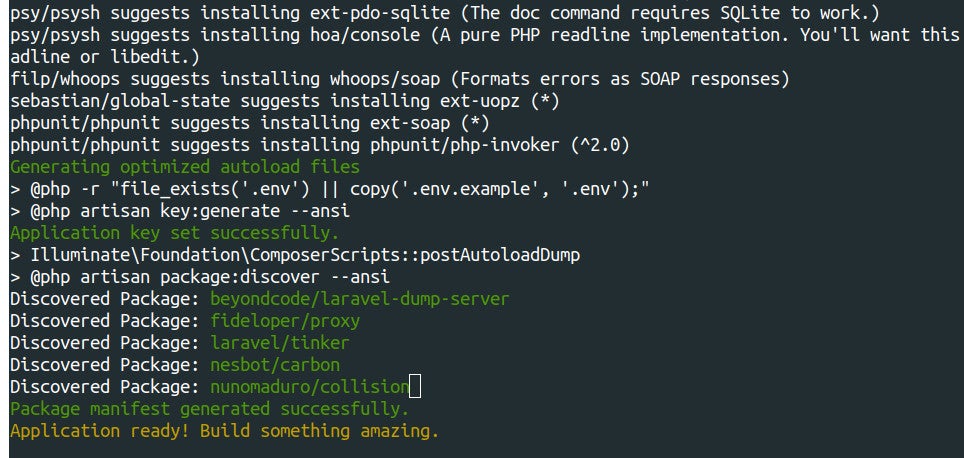
laravel new logging
And there it is—a completed application installed:
Once all of the dependencies have been pulled down and installed, you can change directory and use Artisan to serve your project locally. Artisan is the command-line tool for Laravel—it’s incredibly powerful and is an essential tool in any Laravel developer’s toolkit.
php artisan serve
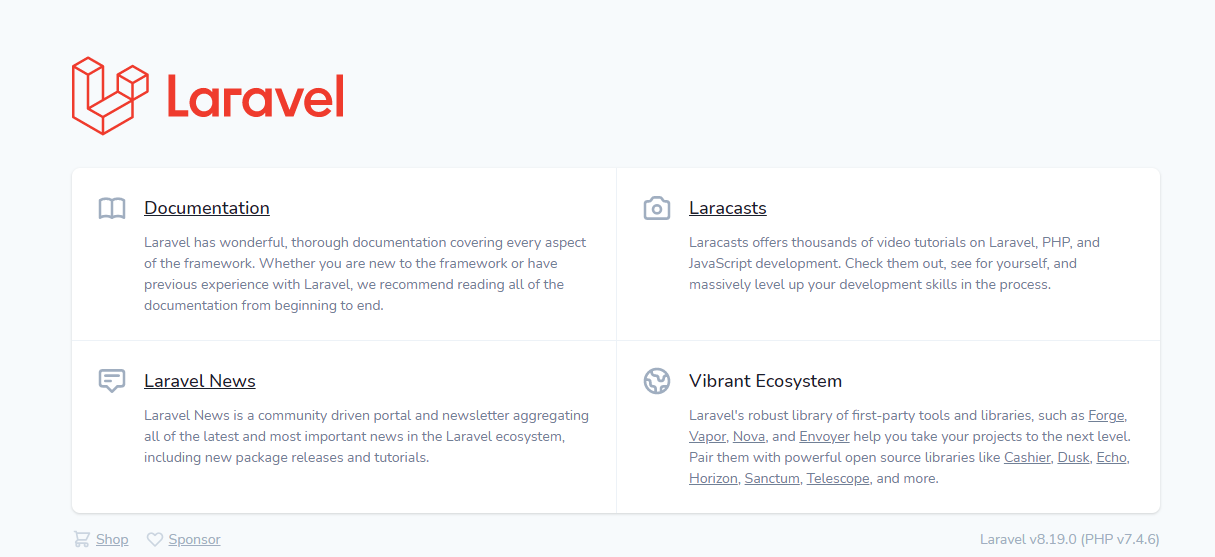
Now, navigate to the address listed, 127.0.0.1:8000, and you should see the Laravel base project display in your browser.
The Simplest Laravel Logging That Could Possibly Work
Now that your application is up and running, let’s do the simplest possible logging. In your text editor, open up the routing file routes/web.php. To log, you’re going to use the Log facade (we’ll see more of this later). So just below the opening PHP tag, add this:
use IlluminateSupportFacadesLog;
The only other piece of code in the file is the route:
Route::get('/', function () { return view('welcome'); });
This code is saying when the route / receives a GET HTTP request, it should resolve the function. As you can see, that function is simply returning the welcome view, which is the page you saw above. To log every time that a user arrives at this page, simply update the code to something like this:
Route::get('/', function () { Log::info('A user has arrived at the welcome page.'); return view('welcome'); });
Check your application is still serving and visit 127.0.0.1:8000 again. If all has gone well, nothing should have changed for the user, but Laravel will have logged this event. And if you open up storage/logs/laravel.log, you’ll be able to find a line to this effect:
[2020-05-01 14:16:39] production.INFO: A user has arrived at the welcome page.
And that’s it! You have successfully logged an event in Laravel.
Logging 101
According to the structure established in earlier installments on the “Get Started Logging With <Tech-Stack>” series, this is the part where we take a detour from the tutorial itself to delve a little bit deeper into logging itself.
You may already have some degree of familiarity with the concept of logging. If that’s your case, you can skip this section without losing much.
On the other hand, if you’re a newcomer to logging—and application logging in particular—read on, since this section will come in handy for you. You’ll learn what is application logging in more detail, why it’s so important, and what it’s involved in a professional, realistic logging approach.
What Is Application Logging?
If you aren’t too familiar with logging, the quick guide above might give you the impression that logging is just a fancy name for writing stuff to a text file. So, is logging just writing stuff to a file?
Well, yes and no.
For starters, though our first example above logs to a file, there’s nothing preventing you from logging to different destinations. Quite the contrary, actually. As you’ll soon see when we talk about channels, there is a wide variety of possible logging targets. Writing log entries to a text file just happens to be a very popular target destination.
Also, the content of your log entries matters a lot. You shouldn’t just log whatever comes to your mind. Instead, you must log information that is relevant. To understand what “relevant” means in the context of logging, let’s head back to the definition of logging presented in the first chapter of the series:
Application logging involves recording information about your application’s runtime behavior to a more persistent medium.
Here you have it: relevant, here, is information that gives you an understanding of how your app behaves while it’s running. But what’s the value in knowing that?
Why Should You Care About Logging?
With the “what” out of the way, the next step in your journey towards understanding application logging is the “why.” Why would you bother learning about how your web behaved in the past?
It all boils down to how complicated software is. I don’t know anything about you, your company, or the type of software that you build, but there’s one thing I can guarantee you: you’ll ship software with bugs. It just doesn’t matter how great your QA strategy is, or how enthusiastic all developers in your company are about unit testing, defects are unavoidable. It’s just the way our field is.
So, when things go wrong in production, your logs are often your only way of understanding the details of the problem. By reading through your log entries, you might be able to gain an understanding of the problem and fix it.
Going Beyond Troubleshooting
One of the main use cases for logging is as a helper in troubleshooting defects in production. Make no mistake: application logging is a lifesaver when it comes to detecting and solving issues in production. But many companies stop there, failing to explore the full possibilities of logging, which can go way beyond troubleshooting.
A logical next step for an organization wanting to take their basic logging approach to the next level is log monitoring. Through the use of specialized tooling, you can monitor your logs in real-time. That way, instead of using logs for solving issues after the fact, you can effectively solve them while they’re happening.
Better yet is to go one step further into the territory of full-fledged log management. Again, with the help of specialized tooling, you can collect all of your logs—application logs and other types—and centralized them into a single location. Then, you can do lots of interesting stuff, such as performing searches on them and visualizing their data in many useful ways. Besides all of that, you can also analyze those logs, obtaining insights that are useful for business decision making.
So, with our detour out of the way, let’s go back to our Laravel tutorial.
Laravel Project Structure
You’ll find that Laravel is quite opinionated about the structure of the projects you create with it. The framework follows a model-view-controller (MVC) architecture, and if you stick to the structure, then all of the auto-discovery features will work seamlessly.
Here’s the Laravel file structure:
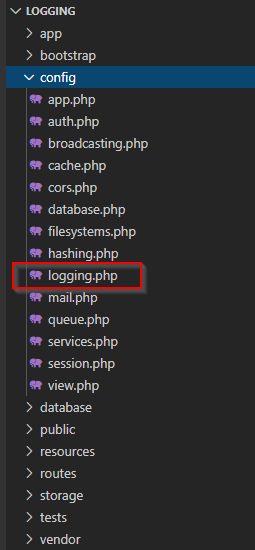
While we’ll look at other parts of the framework throughout this article, the most relevant file for us will be the logging.php file in the config directory. Let’s open that up now and take a look.
logging.php: The Config File
If you open the logging.PHP file using your favorite text editor, you should see something like the following:
<?php use MonologHandlerNullHandler; use MonologHandlerStreamHandler; use MonologHandlerSyslogUdpHandler; return [ 'default' => env('LOG_CHANNEL', 'stack'), 'channels' => [ 'stack' => [ 'driver' => 'stack', 'channels' => ['single'], 'ignore_exceptions' => false, ], 'single' => [ 'driver' => 'single', 'path' => storage_path('logs/laravel.log'), 'level' => env('LOG_LEVEL', 'debug'), ], 'daily' => [ 'driver' => 'daily', 'path' => storage_path('logs/laravel.log'), 'level' => env('LOG_LEVEL', 'debug'), 'days' => 14, ], 'slack' => [ 'driver' => 'slack', 'url' => env('LOG_SLACK_WEBHOOK_URL'), 'username' => 'Laravel Log', 'emoji' => ':boom:', 'level' => env('LOG_LEVEL', 'critical'), ], 'papertrail' => [ 'driver' => 'monolog', 'level' => env('LOG_LEVEL', 'debug'), 'handler' => SyslogUdpHandler::class, 'handler_with' => [ 'host' => env('PAPERTRAIL_URL'), 'port' => env('PAPERTRAIL_PORT'), ], ], 'stderr' => [ 'driver' => 'monolog', 'handler' => StreamHandler::class, 'formatter' => env('LOG_STDERR_FORMATTER'), 'with' => [ 'stream' => 'php://stderr', ], ], 'syslog' => [ 'driver' => 'syslog', 'level' => env('LOG_LEVEL', 'debug'), ], 'errorlog' => [ 'driver' => 'errorlog', 'level' => env('LOG_LEVEL', 'debug'), ], 'null' => [ 'driver' => 'monolog', 'handler' => NullHandler::class, ], 'emergency' => [ 'path' => storage_path('logs/laravel.log'), ], ], ];
The config file for logging starts by importing the Monolog handlers (lines 3-5.) These will be used throughout the logging process, but it’s mostly the framework itself that will use them.
Laravel has some helpful methods that will allow you to log without interacting much with this library directly. Once the config file has imported Monolog, the rest of this file returns an associative array that defines the configuration options for logging in this project.
The first top-level key is default, which, as the name suggests, sets the default logging channel.
As we’ll see later, you can configure this by using environment variables, allowing different solutions for your development and production systems.
The second is the configuration for log channels, in which we’ll be making some changes next.
Log Channels in Laravel
In Laravel, a channel is a log driver with some configuration. You can provide as many different channels for your logs as you would like.
Here, we’re using the single driver to manage my ‘not-urgent’ channel, while we’re using the slack driver to look after my ‘really-urgent’ channel:
'channels' => [ 'not-urgent' => [ 'driver' => 'single' ], 'really-urgent' => [ 'driver' => 'slack' ] ]
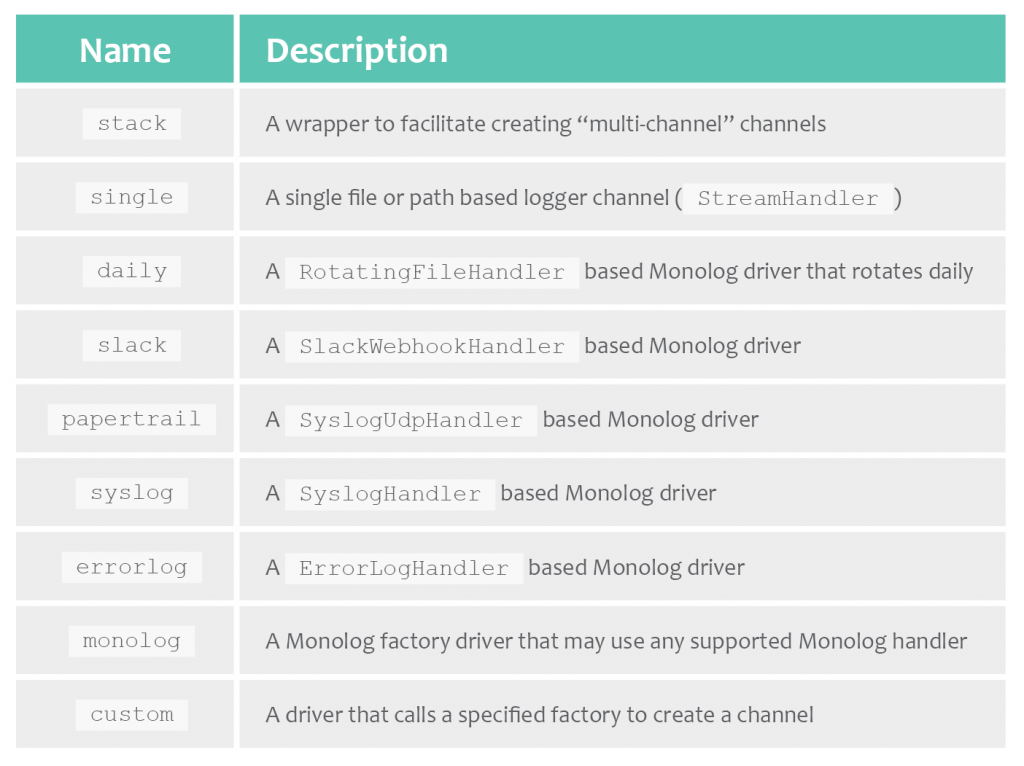
The initial configuration gives the scaffolding for a wide variety of channels covering most of the common use cases. Here are the available channel drivers and a brief description of what they do, as described in the Laravel documentation:
The Log Stack Channel
You may want certain log messages to go to more than one place. Let’s say you want to send a message to Slack, log the message in your rotating daily logs, and have an email sent to your client. Laravel provides the stack driver for this purpose:
'stack' => [ 'driver' => 'stack', 'channels' => ['daily', 'slack'], 'ignore_exceptions' => false, ],
The channel name can be anything you’d like, but in the default configuration, this is simply set to stack. In the configuration array, you pass the driver as stack and an array of the channels you’d like to send to. As can be seen in my example above, I’m sending to the daily channel and the Slack channel. You have to define both of these in the configuration file to be valid. Now, any log message sent to the stack channel will go to the channels in the array.
You may notice the extra configuration option set in the array. Since the aim of the Laravel maintainers is to be as expressive as possible, the purpose of the new option won’t surprise you. By default, Laravel will ignore exceptions in PHP. So you’ll use this option to log exceptions to help with debugging.
As you can imagine, there are more options to change logs than we will explore here. For a more comprehensive exploration, the Laravel documentation is a good place to start.
Log Levels
At this point, let’s talk about log levels. Monolog supports all eight of the logging levels defined in the RFC 5424 specification: emergency, alert, critical, error, warning, notice, info, and debug. If you’re not familiar, it’s a list of descending seriousness. The framework itself declares logging events at different levels, and as you’ll see, you can too.
return [ ... 'daily' => [ 'driver' => 'daily', 'path' => storage_path('logs/laravel.log'), 'level' => 'critical', 'days' => 14, ], ... ];
When configuring a logging channel, you can set the minimum level of event you want to log. The configuration above will log events that are emergency, alert, and critical, but it will discard any events at the lower levels.
Logging in the Environment File
You’ll no doubt have different needs depending on the environment you’re logging in. It makes sense to log all events to a local file while you’re debugging locally. But on a production machine, this can quickly get unwieldy. A large log file that lists everything that has happened may not be useful in diagnosing a problem quickly and effectively.
Likewise, you probably won’t want to send a Slack message to your team every time you forget a semicolon. To help with these environment-specific configurations, we have the .env file in the root of the directory.
In this file, there’s a list of keys and values. By convention, these are in all caps, and words are separated by underscores, like this:
LOG_CHANNEL=stack
When set, any part of the Laravel application will be able to access this through the env() function. This function returns the value of an environment variable. You can set it to return a default but pass a second parameter. Otherwise, it will return null.
return [ ... 'default' => env('LOG_CHANNEL', 'daily') .. ];
In this case, the default channel will be whatever you have assigned in the environment file. If the relevant key, LOG_CHANNEL, is not present, then the env function will return the second parameter, daily.
Note that there will be cases in which you don’t want to pass a default value:
return [ ... 'slack' => [ 'driver' => 'slack', 'url' => env('LOG_SLACK_WEBHOOK_URL'), 'username' => 'Laravel Log', 'emoji' => ':boom:', 'level' => 'critical', ], ... ];
In this instance, we only want to send to Slack when the webhook URL has been defined in the .env file. This key doesn’t exist by default. And so to set up Slack, we’ll need to add a new line to that file with this key and the correct URL from Slack.
Laravel’s Default Logging Configuration
In a moment, we’re going to talk about sending messages to the log channels. But before we do, let’s recap. So far, we’ve explored all of the basic configuration options, as well as some of the more advanced ones. Now, I want to follow the thread of how the application we set up is configured out of the box.
return [ 'default' => env('LOG_CHANNEL', 'stack'), 'channels' => [ 'stack' => [ 'driver' => 'stack', 'channels' => ['daily'], 'ignore_exceptions' => false, ], ... 'daily' => [ 'driver' => 'daily', 'path' => storage_path('logs/laravel.log'), 'level' => 'debug', 'days' => 14, ], ... ];
I’ve extracted the relevant parts from the configuration array above. We can see the default channel is set using the environment variable. Or if that key is missing, it will default to stack.
The stack channel is only pushing messages to a single channel—the daily channel.
The daily channel is configured with a path where log messages will be written to. Its level is set to debug, so it will log all levels of error. The days setting lets Laravel know how many days’ worth of logs to store before it starts to delete them.
So, when we log a message, we’ll navigate to the storage and be able to find them in the directory defined above with the filename laravel-YYYY-MM-DD.log.

The Logging Facade
Now your logs are configured and ready to be used. In order to write to the logs, we’re going to use the Log facade. A facade in Laravel is a static-like interface used to call classes within the framework that are available from the service container. Facades provide a more expressive and readable way for developers to use methods while allowing the underlying classes to be as testable and flexible as possible.
All of the facades in Laravel are available in the IlluminateSupportFacades namespace, so to use the Log facade, you’ll need to include the following use statement at the top of the PHP file you’ll log from.
For our example, I’m going to use the routes/web.php file to be able to add logging to my routes. After the opening PHP tag, add the following:
use IlluminateSupportFacadesLog;
Once imported, you can use the facade to log an event at any of the levels mentioned above:
Route::get('/', function () { Log::info('This is an info message that someone has arrived at the welcome page.'); return view('welcome'); });
You can place these log statements anywhere, and they can serve as a helpful tool to accurately understand what’s working (or not working) in your application.
[2020-05-02 14:21:52] production.INFO: This is an info message that someone has arrived at the welcome page.
As you can see, the log message begins with the timestamp. Following this is the application environment, which the APP_ENV key defines in the .env file. After that, there’s the level of the log message, followed by the message itself.
Logging to a Particular Channel
Sometimes it may be necessary to bypass the default channel and send a message to a specific channel. The Log facade makes that really straightforward:
Log::channel('slack')->info('This is an informative Slack message.');
This would log to Slack with a level of info.
Now, what if you wanted to create a multi-channel stack on the fly? It’s possible to declare this in a really expressive way, as follows:
Log::stack(['single', 'email'])->critical('I need ice-cream!');
You can pass the array of channels to the stack command and chain the log message with the required level.
Sending Contextual Information
A log message on its own may not be very useful, which is why we can also pass contextual information along with the message. This is passed as an array along with the message, and it’ll be formatted and added to the log message.
Log::alert('This page was loaded', ['user' => 3, 'previous_page' => 'www.google.com']);
This will produce a log message that will give you more information to work out the root cause of any potential problems that may be lying within your application. If you have a theory about what might be causing the problem, then you can use logs to gather some evidence and to help you fix it. You can see that demonstrated here:
[2020-05-03 13:21:58] testing.ALERT: This page was loaded {"user":3,"previous_page":"www.google.com"}
Formatting Log Messages
Monolog provides lots of different ways to be able to format your log messages. I’ve left this until the end because it’s not as critical as the other functionality that we’ve discussed so far. The default formatter is the LineFormatter, which in general does a great job of providing readable and helpful messages. If you’d like something more custom, that’s also very possible.
The Monolog documentation gives a full list of the formatters available, ordered roughly in order of use. This is a great jumping off point if you want to make changes to how your log messages look. You can then pass the formatter key and formatter_with key in the configuration array as you define a given channel.
Here’s how you might configure the daily driver to use the HtmlFormatter:
return [ ... 'daily' => [ 'driver' => 'daily', 'path' => storage_path('logs/laravel.log'), 'level' => 'debug', 'days' => 14, 'formatter' => MonologFormatterHtmlFormatter::class, 'formatter_with' => [ 'dateFormat' => 'Y-m-d', ], ], ... ];
Conclusion
For a starter’s Laravel logging guide, it feels like we’ve covered a lot. We explored in depth how to configure logs and how to send messages to different channels. Plus, we even briefly dipped into how to format and understand those logs.
As I mentioned before, the Laravel documentation is very helpful and readable. I’m always finding my way back to reread how to do something. Also, the source code itself is a really helpful source of learning. Feel free to open up the Log facade file and to explore what you find. As you pull on the threads of the code, you will find your understanding deepen and grow.
Lastly, the community of developers around Laravel is incredibly helpful. Reach out and ask for help—we’re all learning!
So, what should your next steps be? Well, you have a lot of learning ahead of you. First, you should go wider than just the specifics of Laravel logging. Learn about logging in general, including which best practices to adopt, and the most common anti-patterns you should avoid.
Additionally, try to learn about the available ecosystem of logging related tools that exist and can help you. For instance, as soon as you have lots of log data, it’s valuable to adopt a tool to help you make sense of all the data. With the aid of a great log aggregation tool, you’ll be able to organize and analyze the data in your logs. You’ll then be able to extract knowledge from all your log files that were just lying there and put that knowledge to good use, obtaining insights that will help you in your decision-making processes.
Scalyr offers such a tool. We recommend you give it a try today.
Good luck with implementing logs in your own projects, using them to speed up your development, understand your problems quickly, and make awesome things!

