
At Scalyr, we’re building a large-scale storage system for timeseries and log data. To make good design decisions, we need hard data about EC2 I/O performance.
Plenty of data has been published on this topic, but we couldn’t really find the answers we needed. Most published data is specific to a particular application or EC2 configuration, or was collected from a small number of instances and hence is statistically suspect. (More on this below.)
Since the data we wanted wasn’t readily available, we decided to collect it ourselves. For the benefit of the community, we’re presenting our results here. These tests involved over 1000 EC2 instances, $1000 in AWS charges, and billions of I/O operations.
Stranger Than You Thought

This graph plots performance over time, for 45 EC2 instances performing a simple steady-state benchmark. The fluctuations indicate that the performance of an individual instance can vary widely over time. If you look carefully, you can see that some instances are much more stable and better-performing than others.
Analyzing the data, we found many patterns. Some things, such as the variations in performance, we’d anticipated. Others came as a surprise; the relationship between instance size, storage type, and performance is more complex than we’d previously seen reported. In this post, we present a variety of findings that we hope are of interest to anyone interested in cloud computing, and that may help you to make better design decisions and avoid performance pitfalls.
I’ll discuss methodology in a later section, but here are the Cliff’s Notes: we tested small reads and writes (“read4K” and “write4K”), large synchronous reads and writes (“read4M” and “write4M”), and small mostly-asynchronous writes (“write4K/64”). We tested a variety of EC2 instance sizes, using instance storage or EBS, on single drives or RAID-0 groups. Each combination was repeated on dozens of EC2 instances.
Cost Effectiveness
This chart shows which configurations give the best bang for the buck — operations per dollar:
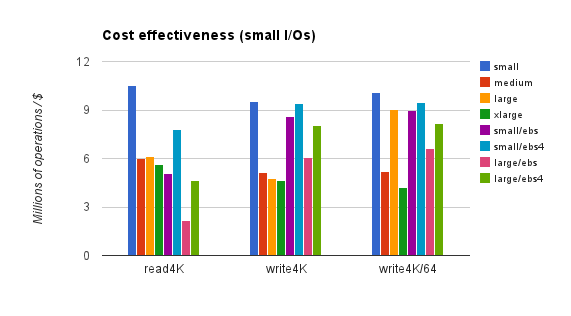
These figures reflect EC2 hourly rates and EBS I/O charges, but not EBS monthly storage fees (which aren’t affected by usage). Rates are for on-demand instances in the us-east region. Reserved or spot instances would reduce EC2 charges substantially, but not EBS charges, meaning that non-EBS instances would look better on the chart. The next chart shows cost-effectiveness for bulk transfers:
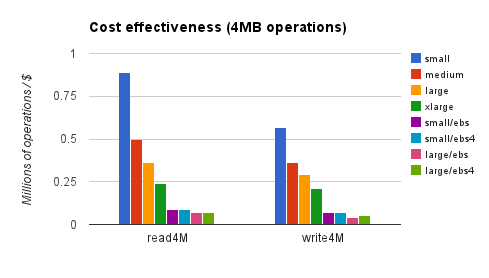
Here, ephemeral storage has a huge advantage, which reserved instances would only amplify.
Impact of RAID
It’s widely held that the best EBS performance is obtained by RAIDing together multiple drives. Here’s what we found:
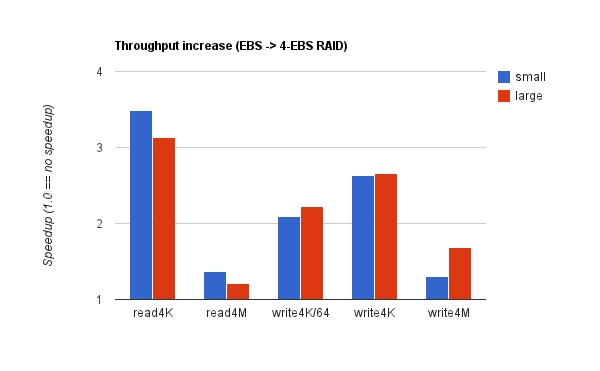
Each bar represents the throughput ratio of ebs4 to ebs on one specific test. In other words, the speedup moving from one to four EBS volumes. Blue reflects m1.small instances, red is m1.large. Each quantity represents an average across 45 instances. RAID offered a substantial benefit for small operations (especially reads), but — surprisingly — not much for bulk transfers. (Note, we did not make much attempt at tuning our filesystem or RAID configuration. See the Methodology section.)
Impact of Instance Size
Amazon states that larger EC2 instances have “higher” I/O performance, but they don’t quantify that. Our data:
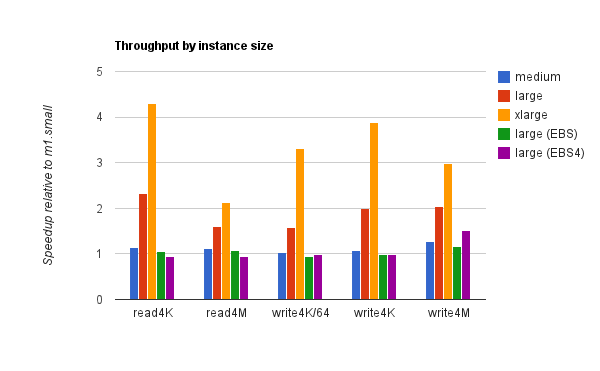
For ephemeral storage, m1.medium was hardly better than m1.small, but m1.large and m1.xlarge show a substantial benefit. (The lackluster performance of m1.medium is not surprising: it has the same number of instance drives as m1.small — one — and the same advertised I/O performance, “low”.)
For EBS, m1.large shows little benefit over m1.small.
If you’ve read this far, you’re probably doing interesting things in the cloud. If you’re doing interesting things, you have “interesting” monitoring challenges. And in that case, you’re just the sort of person we had in mind when we built Scalyr. Try it out.
Bad Apples
You often hear that EC2 I/O is subject to a “bad apple” effect: some instances have markedly poor I/O performance, and you can get big gains by detecting these instances and moving off of them. We found that this effect is real, but applies much more strongly to some use cases than others. Consider the following two charts:
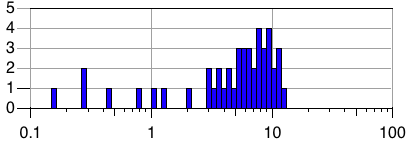
These are performance histograms: the horizontal axis shows operations per second, and the vertical axis shows the number of instances exhibiting a particular level of performance. A tall, narrow histogram indicates performance that is consistent across instances. Note that the horizontal axis uses a log scale.
The first histogram is for bulk writes (write4M) on the small/ebs configuration. 45 instances were tested; the histogram presents the mean throughput for each of those 45 instances. So, the slowest instance sustained roughly 0.3 writes per second (1.2MB/sec write bandwidth), while the fastest sustained a bit over 10 writes/second (40MB/sec) — a difference of more than 30x! Most instances were clustered around 7 writes/second, but 5 out of 45 managed 0.8 / second or less.
The second histogram is exactly the same, but for read4K operations on medium/ephemeral instances. Here, all 45 instances fell in the range of 200 to 300 operations/second; a best/worst ratio of just 1.5 : 1.
So, if you’re doing bulk writes on EBS, you probably need to worry about bad instances. Small reads on EC2 instance storage, not so much. In general, bulk transfers (read4M, write4M) show more variation across instances than small random I/Os (read4K, write4K, write4K/64), and EBS shows more variation than ephemeral storage, but there are exceptions. You’ll find systematic results in a later section (“Variation Across Instances”).
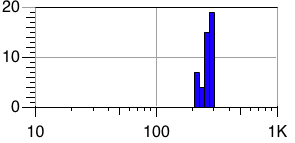
Impact of Parallelism
This chart shows throughput as a function of thread count. Each graph shows results for a particular operation on a particular storage type. Each line shows a particular EC2 configuration. We can see that parallelism often improves throughput, but diminishing returns set in quickly. For all operations except read4K, and write4K on ebs4, 5 threads are enough. In fact, a single thread is enough for good throughput in many cases. But in some circumstances, small reads can benefit from as many as 48 threads.
Interestingly, for large reads on m1.medium / ephemeral, throughput drops, quite dramatically, when more than one thread is used. This effect held up consistently throughout multiple test runs, each on its own fresh set of 30 instances, on multiple days. The fact that we only observed this effect only on m1.medium serves to highlight the importance of testing the exact configuration you plan to use.
We can also see in this chart that EBS offers inexplicably good performance for small writes. For instance, write4K on large/ebs executes over 800 operation/second with a single thread. This implies a mean latency of roughly one millisecond — barely enough time for a network roundtrip to an EBS server. Either Amazon is doing something very clever, or EBS does not actually wait for durability before acknowledging a flush command.
Variation Across Instances

This chart shows how performance varies across 45 nominally identical instances. Each graph presents one benchmark. The vertical axis plots latency, and the horizontal axis plots the individual instances, sorted from best to worst. The five lines represent various latency percentiles, as indicated by the color key. If all instances behaved identically, the graphs would be quite flat, especially as we’re using a log scale.
Remember that the horizontal axis shows EC2 instances, not time. A sloped graph indicates that some instances were faster than others. Continuous slopes indicate gradual variations, while spikes indicate that some instances behaved very differently.
We can see that ephemeral storage latency is fairly consistent in general, though it’s not uncommon to have a few outliers. (For instance, for read4K on m1.xlarge / ephemeral, one instance appears to have mean latency more than 4x worse than the best instance.) Our sample size is too small to properly judge the prevalence of these outliers. Also, note that bulk transfers show more variation than small operations.
EBS shows more variation, except for write4K/64. writeFlush operations (write4K and write4M) are especially bad, with 10:1 variation the norm.
Note that larger instances don’t always appear faster here, because we’re working them harder (more threads), and these graphs show latency rather than throughput.
Performance over time (A Twisty Maze of Instances, All Different)
Next, we examine how throughput varies over time. Each graph contains 45 lines, one per EC2 instance. The vertical axis is throughput, and the horizontal axis is time. The total time span is 10 minutes. This is not long enough to show long-term trends, but with 45 test instances, there is some scope for infrequent events to manifest.
The vertical axis on each graph is normalized to the maximum sample for that graph, so you should not attempt to compare values across graphs.
To my mind, this is the most remarkable chart in the entire investigation, because no two graphs look alike. If throughput were consistently stable over across instance and time, each graph would be a single thin bar. Instead, we see collections of horizontal lines (indicating performance that varies from instance to instance, but is steady over time); widely spaced horizontal lines (more variance between instances); wiggly lines (performance oscillating within a stable band); wild swings; gradual upward or downward motion; high-performing outliers; low-performing outliers; bimodal distributions; and more.
There do seem to be a few general trends. EBS is noisier than ephemeral (EC2 instance) disk, which is is not surprising — EBS has more moving parts. And on EBS, write performance is more variable than read performance. (Which is not to say that EBS reads are more consistently fast. It’s more that reads are consistently slow, while EBS writes are usually-but-not-reliably faster.)
We see confirmation here that in some cases there are “good” and “bad” instances, but we don’t have enough data to determine whether this is stable over long periods of time — whether good instances remain good, and bad instances remain bad.

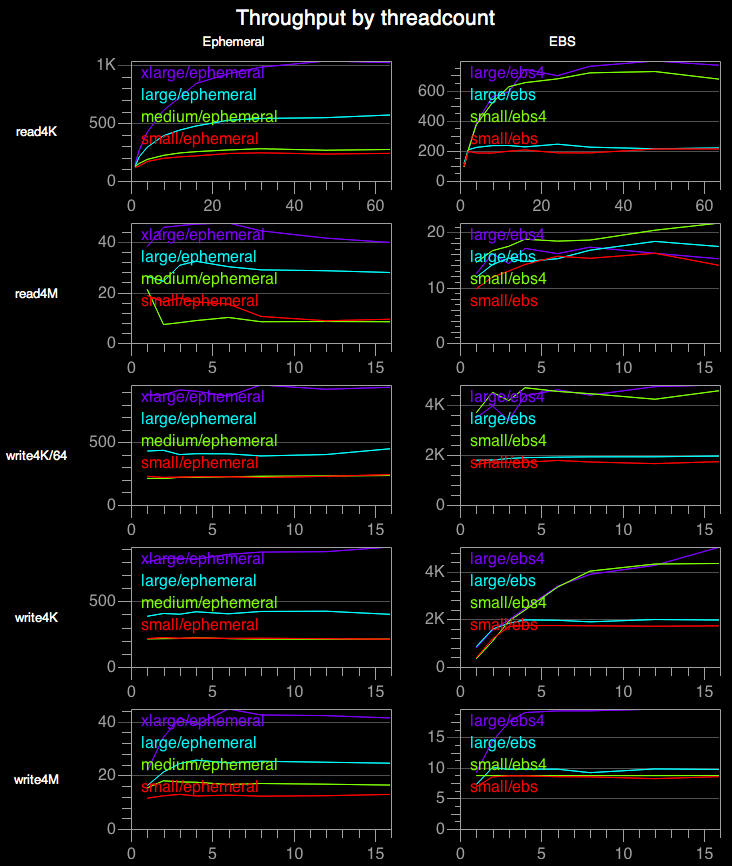
Single-threaded latency
This chart shows operation latency. Most of the results we’ve examined a thread count that optimizes throughput, but here we use a single thread, minimizing latency. The X-axis indicates which instance setup was used (see the legend at the bottom of the chart), and the Y-axis shows latency in milliseconds. Values are based on aggregate performance across 30 instances. The left column shows median, mean, and 90th percentile latency; the right column shows 99th and 99.9th percentile. I don’t present results for bulk transfers (read4M and write4M), as these are inherently throughput-oriented.
We can see that small reads (read4K) take roughly 10ms on every machine configuration. This makes sense, as the benchmark is designed to force a disk seek for every read, and seek time is likely to dominate other factors such as network latency. (There is a slight decrease in read latency on larger instances. That’s probably a caching artifact — m1.xlarge instances have enough RAM to cache roughly 20% of our 80GB file.)
The write4K results seem difficult to explain. For instance, why do larger instances show such drastically lower latency? And how can writes possibly be made durable so quickly, especially for EBS where a network hop is involved?
For write4K/64, the median and 90th percentile latencies hug the floor, which make sense as over 98% of these operations are not synchronously flushed and hence don’t wait for disk. The mean and higher percentiles follow roughly the same pattern as write4K.
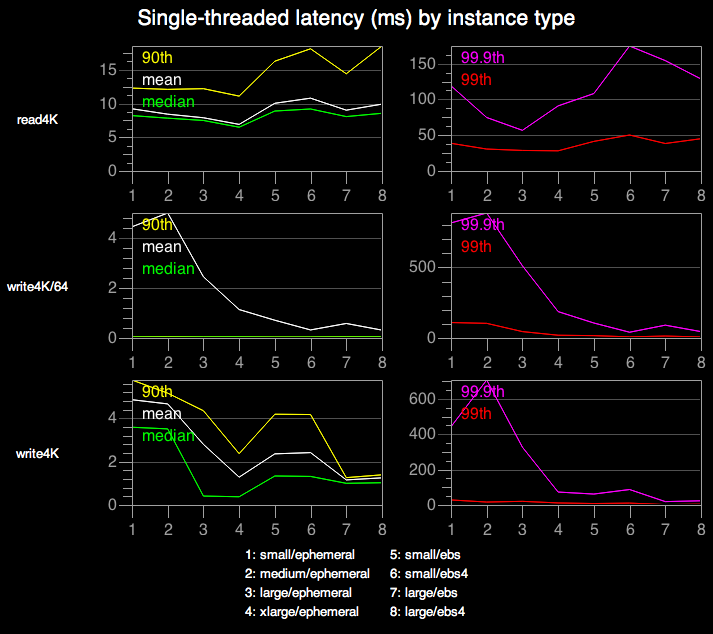
For a final bit of fun, let’s look at a detailed histogram for one benchmark:
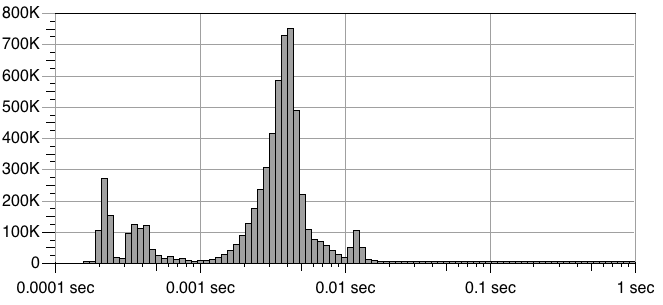
This shows latency for write4K operations on the xlarge/ephemeral configuration. The horizontal axis shows latency (log scale), and the vertical axis shows the number of individual operations with that particular latency. Each spike presumably indicates a distinct scenario — cache hit; cache miss; I/O contention with other tenants of the physical machine; etc. Clearly, several mechanisms are coming into play, but it’s not obvious to me what they all might be.
Methodology
“I/O performance” is a complex topic, involving the filesystem, device drivers, disk controllers, physical disk mechanisms, several levels of caching, buffering, and command queuing, etc. Caching aside, the two most important factors are seek time and bandwidth.
It’s important to remember that these are independent. A storage system can have high bandwidth but poor seek time, or the reverse. For an extreme example, consider your DVD collection. (Some of you must remember DVDs.) A “seek” involves walking over to the shelf, grabbing a disk, inserting it into the player, and waiting for it to load — a long time! But once the disk has loaded, the player can stream data at fairly high bandwidth. At the opposite extreme, early generation digital camera memory cards had fast “seek” times, but limited bandwidth.
With all this in mind, we performed two sets of benchmarks, each structured as follows:
1. Allocate a number of identical EC2 instances. The remaining steps are executed in parallel on each instance.
2. Create a single 80GB disk file, populated with random data. (80GB should be large enough to minimize cache effects, ensuring that we are measuring the performance of the underlying I/O system. Note that AWS may perform caching at a level we can’t control, so filesystem or kernel flags to disable caching are not sufficient. An 80GB file is our “nuke the site from orbit” approach to disabling caches.)
3. Spin up a number of threads (T), each of which runs in a tight loop for a specified duration. For each pass through the loop, we select a random position in the file, synchronously read or write a fixed number of bytes at that position, and record the elapsed time for that operation.
Step 3 is repeated multiple times, for various combinations of threadcount and operation. The operation is one of the following:
- read4K: read 4KB, at a 4KB-aligned position.
- read4M: read 4MB, at a 4MB-aligned position.
- write4K: write 4KB of random data, at a 4KB-aligned position.
- write4M: write 4MB of random data, at a 4MB-aligned position.
- write4K/64: like write4K, but with fewer flushes (see below).
For write4K and write4M, the file was opened in writeFlush mode (each write is synchronously flushed to disk). For write4K/64, the file was opened in write mode (no synchronous flush), but after each write, we perform a flush with probability 1/64. In other words, for write4K/64, we allow writes to flow into the buffer cache and then occasionally flush them.
All of this is repeated for eight different EC2 configurations. The configurations differ in EC2 instance type (m1.small, m1.medium, m1.large, or m1.xlarge), and disk arrangement:
- “Ephemeral” — drives associated with an EC2 instance. For instance types with multiple instance drives (e.g. m1.large), the drives were joined using RAID0.
- “EBS” — a single EBS volume.
- “EBS4” — four EBS volumes, joined using RAID0.
We tested eight of the twelve possible combinations. I will refer to these using a shorthand, such as “small/ebs4” for an m1.small instance with four EBS volumes in a RAID0 arrangement, or “xlarge/ephemeral” for an m1.xlarge instance with its instance drives also in RAID0.
For the first set of benchmarks, 30 instances of each configuration were used — a total of 240 instances. Each instance performed a series of 42 two-minute benchmark runs:
- read4K: 10 separate runs, one each with T (threadcount) 1, 2, 4, 8, 12, 16, 24, 32, 48, and 64.
- read4M, write4K, write4M, write4K/64: 8 runs each, with T = 1, 2, 3, 4, 6, 8, 12, and 16.
Each instance performed these 42 runs in a different (random) order. This benchmark was primarily intended to explore how performance varies with threadcount.
For the second set of benchmarks, 45 instances of each configuration were used — 360 instances in all. Each instance performed a series of 5 ten-minute benchmark runs: one for each of read4K, read4M, etc. Here, we used whatever threadcount was found, in the earlier benchmarks, to yield optimal throughput for that configuration and operation type. This benchmark was intended to provide a lower-variance view of performance across instances and instance types.
Here are the threadcounts used in the second run. (Note that we incorporated a slight bias toward smaller threadcounts: we used the smallest value that yielded throughput within 5% of the maximum.)
| read4K | read4M | write4K | write4K/64 | write4M | |
| small/ephemeral |
24 |
1 |
1 |
16 |
2 |
| small/ebs |
48 |
6 |
3 |
2 |
3 |
| small/ebs4 |
32 |
16 |
12 |
2 |
1 |
| medium/ephemeral |
24 |
1 |
1 |
6 |
2 |
| large/ephemeral |
48 |
3 |
4 |
1 |
3 |
| large/ebs |
8 |
12 |
4 |
4 |
2 |
| large/ebs4 |
16 |
4 |
16 |
12 |
4 |
| xlarge/ephemeral |
32 |
2 |
12 |
1 |
6 |
All tests used ext3, with the default block size (4KB) and noatime option. RAID0 configurations used the default 512KB chunk size. No special attempt at filesystem tuning was made. We used the default Amazon Linux AMIs (ami-41814f28 and ami-1b814f72).
This work was done shortly before Amazon introduced solid-state storage, EBS-optimized instances, and provisioned IOPS. We may examine these options in a followup post.
Thoughts on Benchmark Quality
Since the dawn of time, repeatability has been a critical topic for benchmarks. If you run the same benchmark twice, you often get different results. Cache state, background tasks, disk hardware glitches, and a thousand other variables come into play. For this reason, it’s always been good practice to run a benchmark several times and take the median result.
In the cloud, this tendency is vastly amplified. Remember that histogram of bulk write throughput across EBS instances? The variation from best to worst instance wasn’t a few percent, it was thirty to one. Thirty to one! This means that a single-machine test could easily report that small instances are faster than xlarge instances, or any other sort of nonsense.
Under these circumstances, for a cloud benchmark to have any validity, it must include data from many machine instances. Single-machine data is worse than useless; you simply don’t know whether you’re measuring application behavior, or random cloud background noise. Don’t just take single-machine cloud benchmarks with a grain of salt: ignore them entirely.
It’s also important to be very clear on what your benchmark is measuring. Application-level benchmarks are complex, and hard to generalize. Knowing how long a system takes to build the Linux kernel doesn’t tell me much about how it will handle MySQL. For that matter, MySQL performance on your workload may not say much about MySQL performance on my workload. So the gold standard is always to perform your own tests, using your actual application, under your actual workload. But failing that, the benchmarks with the greatest general applicability are those that measure basic system properties, such as I/O bandwidth.
With all this in mind, I’d like to propose a set of guidelines, which I’ll call “Cloud Truth”, for cloud benchmarks. (By analogy to “ground truth”, which refers to the process of going to a location and taking direct measurements of some property, to calibrate or verify satellite images or other remote sensing. More broadly, “ground truth” represents the most direct possible measurement.) For a result to be considered Cloud Truth, it should:
- Directly measure basic system properties
- Include measurements from many instances
- Over a substantial period of time
- Use clearly explained, reproducible methods (preferably including source code)
- Clearly explain what was measured, and how
- Clearly explain how the results were averaged, aggregated, or otherwise processed
This is not easy. (The results I’m presenting here fall short on “substantial period of time”.) But when reporting cloud benchmarks, these are the standards we must aspire to.
Limitations / Future Work
Considerable effort and expense went into these benchmarks, but there is still plenty of room to explore further. Some areas we haven’t yet touched on:
- How instances behave over long periods of time
- New AWS I/O options (solid-state storage, EBS-optimized instances, and provisioned IOPS)
- Tuning filesystem and RAID configuration
- Impact of EBS snapshots
- Variations across AWS zones and regions
- Other cloud providers
- Single-tenant and/or non-cloud machines
One Last Plug
If you’ve read this far, you probably take your engineering seriously. And if so, you’d probably like working at Scalyr. Why not find out?
If there’s interest, we’ll publish the raw data and source code for these benchmarks. Drop us a line at [email protected].
Thanks to Vibhu Mohindra, who did all the heavy lifting to implement and run these benchmarks. Also to Steven Czerwinski and Christian Stucchio for feedback on an early draft of this post.

