
In today’s data-focused world, we want to identify and use metrics to improve our customers’ experience. And when it comes to incident management, we often talk about the concepts of mean time to repair and mean time between failures.
Both of these metrics help identify the effect that system incidents have on our customers’ experience. If we take too long to repair an issue, the customer will complain about the length of downtime. And shorter times between failures result in a seemingly flaky system that goes down right when you need it.
Therefore, we want to reduce the impact that system incidents have on our customers. And we want to continuously improve over time. Today we’ll discuss the first of the two metrics mentioned: mean time to repair (MTTR).

What Is Mean Time to Repair?
Mean time to repair measures the time it takes a team to resolve an incident. And if that sounds simple, you may wonder why some people seem confused about the meaning of this metric. However, MTTR can stand for mean time to repair, to resolve, to respond, or to recover. And each of these has had different definitions at times, with plenty of overlap.
But I don’t want to get bogged down in definitions and the history of all of these terms. The important thing when looking at your incident management process is to create a common understanding of the terms and metrics. And then you’ll want a series of steps that you can use to improve the metrics that matter to your customers.
For today, let’s establish this common definition for time to repair: the time from the start of an incident or outage until the system is back up and running in a healthy state. In short, it’s the downtime of your system during an incident. And the mean of the time to repair is equal to all the time spent repairing divided by the number of incidents that your system experiences.
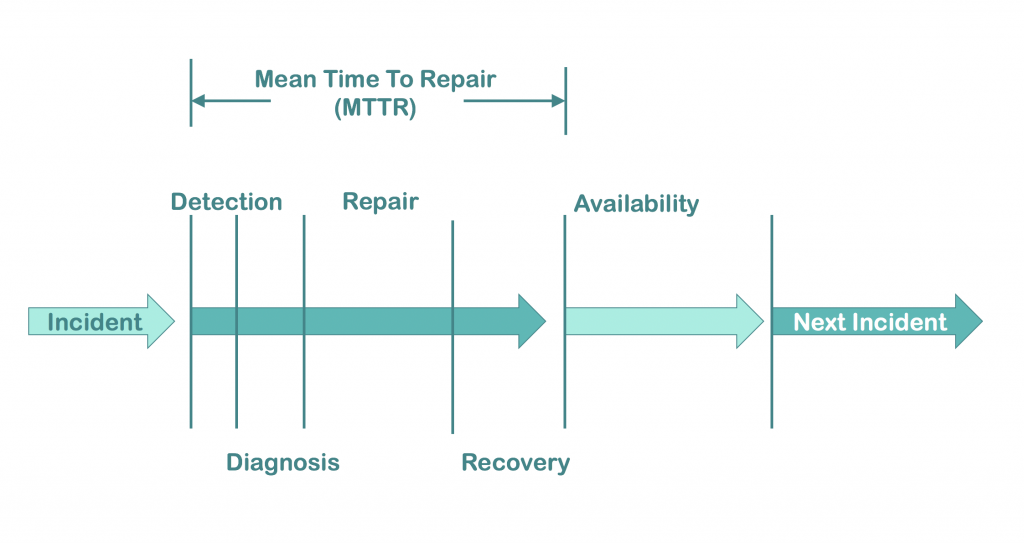
So no matter what your internal monitoring, your help desk, or your customers tell you, the clock starts when your system begins to fail or degrade. And it doesn’t end until everything has been restored.
As you can see in the chart above, this provides a number of subsections that we can work to improve. And that’s an important key. If we’re just going to look at TTR all on its own, it may be daunting to figure out how to reduce that time. But if we look at each component separately, we can then begin to find ways to shorten the overall TTR for incidents.
Now let’s dive into how we can improve our MTTR.
Reducing Mean Time to Repair
As mentioned above, MTTR has a few subsections that we can dive into. Let’s look at these and see how we can help reduce the duration of each. And let’s talk about how Scalyr can help you.
Reduce the Time to Detect
How many of us have been informed by people outside our team that our system is down? Perhaps it came from another internal team that calls our services, or even from our end customers calling our help desk. Either way, it doesn’t feel good to find out from someone else that something is going wrong. If we rely on others to tell us when there’s a problem with our system, then we will never have a good metric for our time to detection. We’ll always be the last to know when our systems fail.
So how do we improve the time it takes to detect incidents? In short, we want to use automated alerting.
Luckily for us, we can create alerts with Scalyr whenever our service-level indicators hit a certain level. For example, we can create alerts when our latency goes above a certain threshold or when our CPU is too high for an extended period of time. The alerts you set will depend on your system, your architecture, and your customers’ needs. However, here are some common alerts you may want to automate.
- Saturation thresholds: Adding alerts around system resources like CPU, memory, or storage size can notify you when those values approach critical levels. The important piece to note here is that it should be outside the norm. If your servers always spike CPU after deployment but then reduce over time, there’s no need to report on that. But if there is a continued increase that’s unexpected, it’s time for someone to take a look and fix—or even prevent—an incident.
- Server errors: Additionally, adding alerts when the number or percentage of system errors reaches a certain threshold can notify you of bugs or system issues.
- Client errors: You can also alert your team when the number or percentage of client errors reaches a certain threshold. You may think that client errors aren’t your responsibility, but if everyone suddenly begins receiving a “bad request” response from your APIs, it might not be their fault. And you may have an incident on your hands.
- Latency: Finally, consider creating automated alerts when your system latency either approaches or reaches unacceptable levels. Slowness can drive customers away more than errors and outages.
Once you’ve got the basic alerts automated, then consider what business metrics may also indicate a problem. These will be more specific to your particular domain. But think about what data could indicate a problem. The alerts don’t just have to be about the technology, they can also be about the customer journey.
Reduce the Time to Diagnose
Now that we’ve reduced detection time, we need to improve the time it takes to diagnose the incident.
First, you’ll want to make sure your applications are logging properly so that problems can be diagnosed quickly. Make sure logs provide adequate information on errors, helping engineers recreate the problem quickly.
Next, you’ll want to set up dashboards and searches that will give you a good view of what’s going on in the system quickly. Dashboards displaying the four golden signals of your APIs, the health or responses of your dependencies, or even business-facing metrics that shed light on the customer’s experience can assist in pinpointing where things go wrong.
And finally, having good alerts includes giving relevant information to the person diagnosing the issue. You can reduce diagnosis time by including links to your system runbooks, relevant dashboards, or other documentation that will help resolve issues. To assist, Scalyr includes the ability to build SmartLinks, using data that you have in your log to create those links.
Reduce the Time to Fix
Now that we’ve been alerted to and have diagnosed the problem, it’s time to fix it. Depending on your diagnosis, you may fix the issue in different ways. Perhaps you have to restart a server or container. Or maybe roll back a deploy or config change. In fact, you may find a bug in the code and decide to fix it right then and there.
No matter what the approach, you’ll want automation to help get through this process quickly.
So for code changes, make sure you have a solid automated test suite that can ensure your fix isn’t worse than the original incident. And that hopefully you can prove the fix without manual testing.
If you’re not going to change the code, you will want an automated way to roll back your code. Instead of trying to rebuild packages or manually moving things around, make sure your CI/CD pipeline has an easy one-button rollback process that will get your customers up and running quickly.

Reduce the Time to Recover
And finally, we move to recovery. This will include the actual deployment of new code, the spin-up of new or redundant servers, and more. Again, you’ll want good logging and metrics so that if something else goes wrong, you don’t have to jump back to square one. Because, as many of us have seen, oftentimes incidents don’t follow the happy, simple path above. We may think we’ve fixed the issue, but until we truly resolve things, our time-to-repair clock is still running.
Again, use your logs, dashboards, and alerts to make sure the system is fully restored before celebrating your quick win.
Summary
And there you have it. Now you’ve got a good handle on what mean time to repair consists of. And you’ve learned concrete ways of improving the time it takes to repair your system. As you can see, it doesn’t take magic or AI to improve incidents. What it takes is an understanding of the different components that make up MTTR and ways of improving each.
We can slice and dice our incident metrics in many ways. The important point is to make sure that the metrics are actionable and that you have the tools to help teams do better.
To get started, try Scalyr for free. And begin tracking your incident metrics and improving them over time.

