
Understanding what’s going on with your applications is critical. Without insight into the state of your application, you can’t tell if there were any problems, such as downtime issues, code errors, or latency. If you want to provide the best possible experience for your customers, you need a way to “see” the state of your applications. This where logging, especially log visualization, comes to play. This post is about log visualization, how (and why) you should use it, and how it helps your logs to “come to life.”

Post Breakdown
I’ll start with an explanation of why logging is important and how we did it in the early days. Then I’ll fast-forward to our day and age and explain how log visualization makes your logs so much more useful than before.
The Rationale Behind Logging
As you probably know, logging is a vital tool that gives you visibility into your application. Basically, logging important events in your application is the cornerstone technique of understanding what, where, and when things happened. Furthermore (and most importantly), your log can usually give you the answer to why an event has happened. To get a bit more technical, the way to understand events in the system is to write descriptive and relevant information about them to a file/internal log system/SaaS log service (more on this later).
Examples
Client got an error message? Request to an external service took too much time? Database was not accessible? Your site experienced a DDoS attack? Log away. For instance, in the case of a DDoS attack, the relevant data to log would be the IPs and geographies of the requests coming to your website, the pages that were attacked, and whether any of your mitigation mechanisms were deployed (like fail2ban and Apache’s mod_evasive).
Logging in the Old Days
In the early days of the internet era, to log data you would basically write the errors and any other output from your application or service to a file on a disk. Getting insights from those files required parsing them manually (with tools like grep and awk) and acting upon the data. Old log files were periodically zipped and transferred to an archive (whether manually or automatically). This worked well enough when the organizations deployed applications as monoliths. The log size was generally modest, you had only a few applications, and the log files didn’t grow quickly or unexpectedly.
Things Break
This all changed in recent years with the move to microservices-based architecture. With microservices, your app is deployed on many different machines (sometimes thousands), usually via containers. In addition, the volume of data stored in logs grew exponentially (sometimes TBs of data). Lastly, the number of applications and other sources of logs grew substantially as well. All the above made the old approach of parsing logs manually one machine at a time very hard. The industry analysts expect this trend of big data to continue and even accelerate. New approaches to logging will become even more important in the future.
Logging in 2020
In order to handle this kind of complexity, companies are moving away from the old logging model. The new model is a centralized log store that is provided as a service. Those SaaS log management services aggregate logs from all your development environments: dev, staging, and production, and from all your applications. This gives you a centralized view of your business operations. With this method, you no longer need to hop from machine to machine to read the logs. Usually the way to implement this logging process on a technical level is to add an “agent” service in each of the machines that run your applications to gather the local log entries and submit them to the SaaS servers.
Log Visualization: How and Why To Bring Your Logs To Life
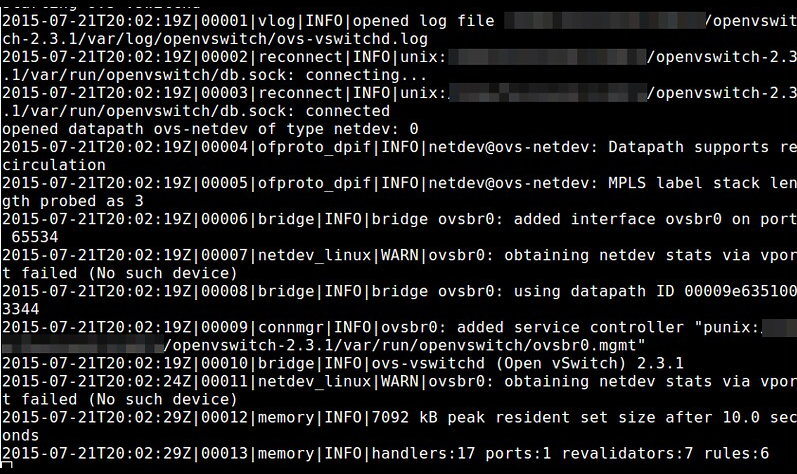
In addition, those services give you a graphical representation of your logs. This is much easier to understand than the old “line by line” black-on-white format. Just compare the old way…
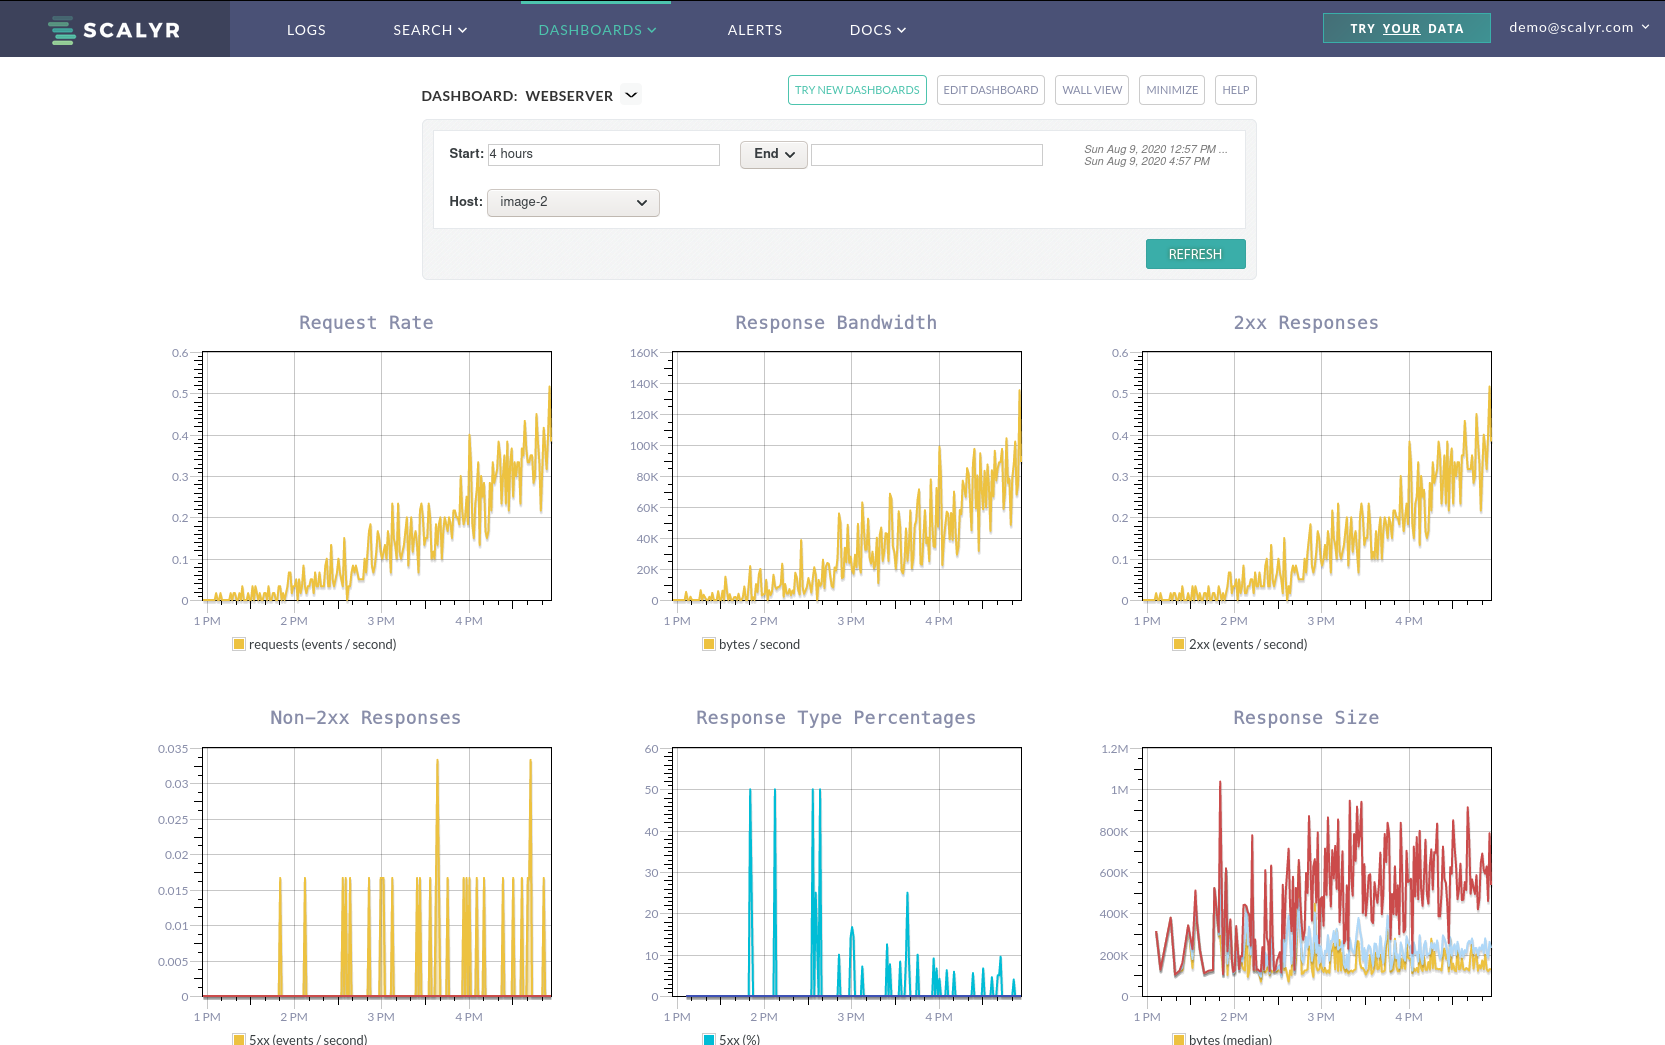
…to how logs looks in Scalyr (taken from the Scalyr demo):
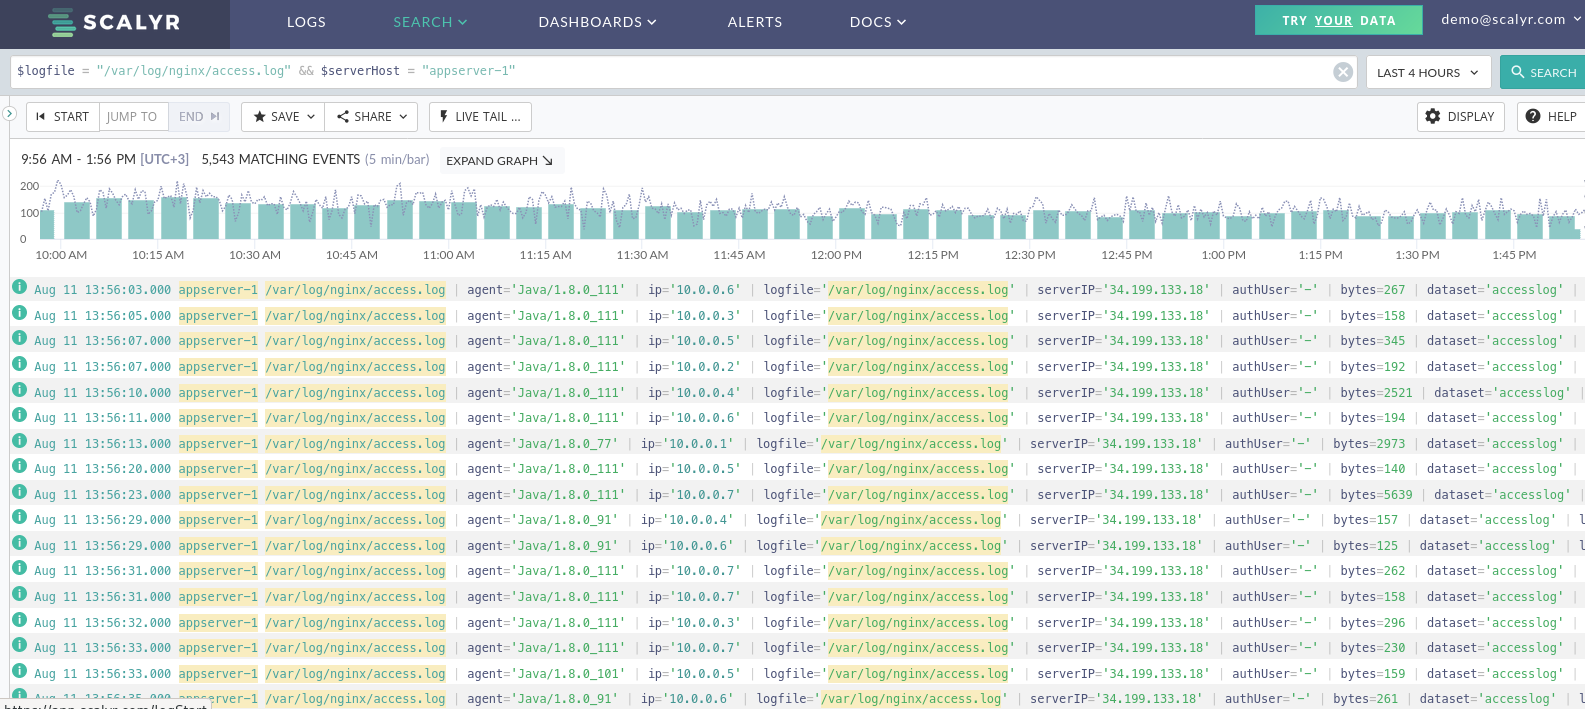
Don’t worry. If you want your classic line-by-line logs, they’re still available. But they’re much more readable:
This is not just an aesthetically important issue. Better visualizations allow you to see things you didn’t see before. Moreover, better visualizations allow you to understand things you couldn’t understand before. In short, log visualizations give you a more complete view of your applications.
Log Visualization Adds Value
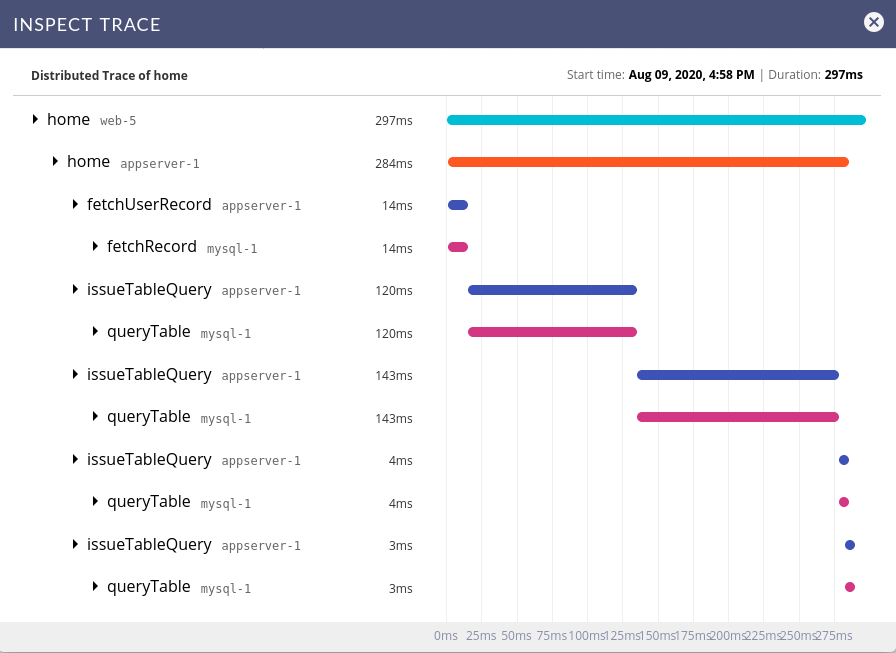
As you can see from the first Scalyr screenshot above, log visualization allows you to see aggregated information for your different applications. That includes requests, responses, response size, and more. With this, you can now have a ten-thousand-foot view of the current state of your applications. You can instantly tell how your applications are doing and drill down to specific issues if needed. In addition, as shown in the screenshot below, a log visualization allows you to see what happened to a request flow, end to end. This is especially important today with the rise of microservices and distributed applications. For example, here’s Scalyr’s distributed trace visualization:
Real-Time Visualization
Another important benefit of those SaaS services is the ability to seeincoming logs in real time. This enables the developer/DevOps engineer to trigger a function in the application and instantly see how it effects important metrics. This enables the developer to quickly fix production issues and bugs.
Interactive Drill Down
You can start with the high-level value of your application and then do a visual drill down when pressing on problematic metric graphs. This allows you to quickly find the data you’re looking for and share it with your colleagues if required. In addition, the high-level view gives technical staff and field-level engineers an easy way to communicate their findings with upper management. This shortens the turnaround time on decision-making and allows the organization to move faster.
Log Queries
If you’re used to manually parsing logs with grep and similar tools, you’ll be happily surprised to discover that centralized logging services provide a powerful SQL-like query language to parse your logs. This ability (to do power searches on terabytes of data instantly) combined with log visualization can give you valuable insight into the nitty-gritty parts of your business. You just have to enter the right query, and then you can visualize the results. For instance, you can look for all 500 error codes across all machines that were accompanied with an “Exception: class not found” message and see a graph of those incidents over time.
Conclusion
Modern applications require a new approach to managing and parsing log data. The proliferation of distributed applications, the increasing amount of log data, the velocity of incoming log data and CI/CD practices that require multiple development environments (each with its own logs, of course)—all of this rendered the old approach of writing on a machine to disk and manually parsing logs obsolete. And these trends will only continue.
Companies are now moving to centralized SaaS log management solutions. In addition to providing a one-stop-shop for all your logs, these solutions provide log visualization, an important feature that enables you to instantly grasp the state of your applications. Compared to the standard method of logging, log visualization lets you “see” and understand better what is going on with your applications. In turn, it empowers you to make better, faster decisions about your software. In conclusion, log visualization makes you more responsive and agile. It has a quick return on investment and provides a clear benefit for any company’s development and operations teams.

