
Logs come in various formats and are stored in multiple locations. Getting insights from all of these logs isn’t a trivial task. Microsoft Log Parser is a tool that helps us extract such information easily using a SQL-like syntax. It supports many different input and output formats. But it also has some limitations because of its age.

Introducing Log Parser
According to Microsoft, Log Parser “provides universal query access to text-based data such as log files, XML files, and CSV files, as well as key data sources on the Windows® operating system such as the Event Log, the Registry, the file system, and Active Directory®.” Also, it says, “The results of your query can be custom-formatted in text-based output, or they can be persisted to more specialty targets like SQL, SYSLOG, or a chart.”
Installing Log Parser is easy. Just download the installer from Microsoft or use Chocolatey. Log Parser is a command-line tool. If you prefer, you can use Log Parser Studio, a graphical user interface that builds on top of Log Parser. Log Parser Studio also comes with many default queries, which is very useful if you use the tool for the first time.
How Log Parser Works
Log Parser will parse a variety of logs in such a way that you can execute SQL-like queries on them. This makes it a useful tool for searching through large and/or multiple logs. You point Log Parser to a source, tell it what format the logs are in, define a query, and write the output somewhere.
An example will make this clear. This query will show us the number of errors per day in the Application event log:
LogParser "SELECT QUANTIZE(TimeGenerated, 86400) AS Day, COUNT(*) AS [Total Errors] FROM Application WHERE EventType = 1 OR EventType = 2 GROUP BY Day ORDER BY Day ASC"
You can run this in the installation folder of Log Parser. But it’s a long statement that we have to keep on one line. It’s also hard to remember. We can put this query in a SQL file and format it nicely like below:
SELECT QUANTIZE(TimeGenerated, 86400) AS Day, COUNT(*) AS [Total Errors]
FROM Application
WHERE EventType = 1 OR EventType = 2
GROUP BY Day
ORDER BY Day ASC
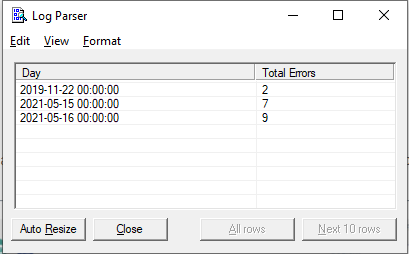
On my computer, this produces the following result:
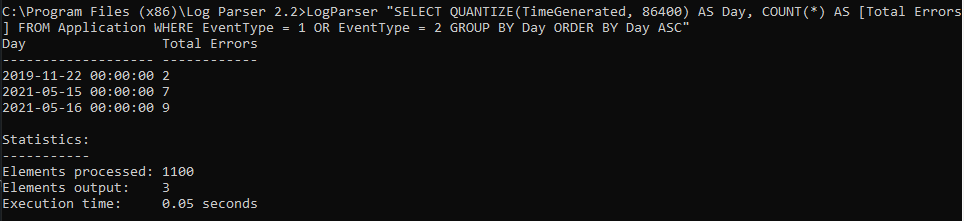
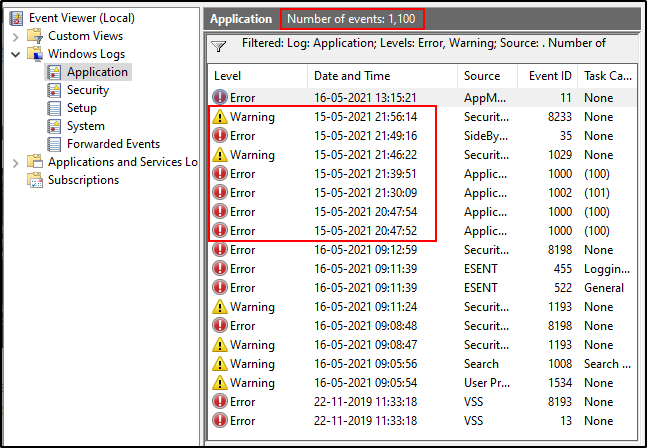
If I open my Event Viewer and check the Application log (under Windows Logs), I’ll see that these results are correct. EventType 1 indicates errors and EvenType 2 indicates warnings. I can see that there were seven errors and warnings on the 15th of May. I also see that the Elements Processed value i.e., 1100 in the above screenshot is the same as the value of “Number of events” in the event manager. This confirms that Log Parser is parsing all available logs for our filters.
If you have access to a remote machine, you can even run Log Parser on your machine but query logs on the remote machine. Just add “machinename” to the “FROM” clause, e.g.:
SELECT TOP 10 *
FROM \\myServer\Application
An IIS Example
I briefly want to show you an example of parsing IIS logs, as many readers probably work with IIS on a regular basis.
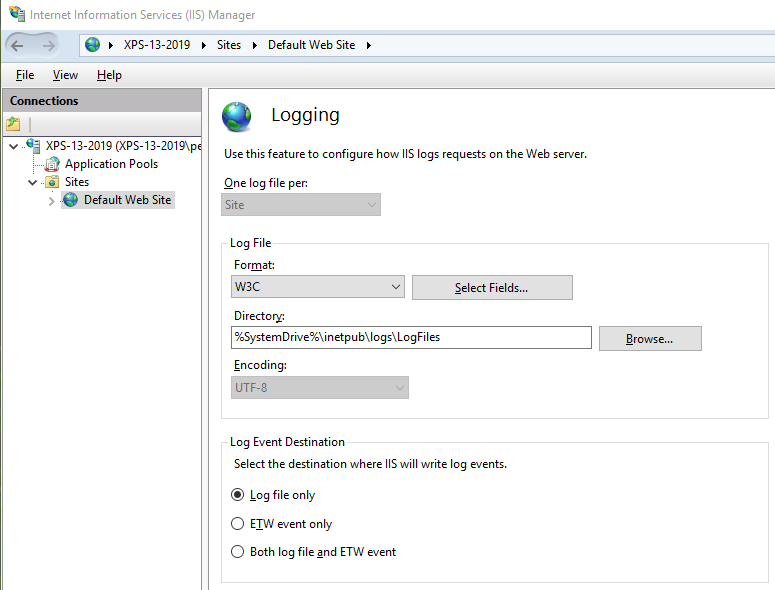
First, IIS logging must be enabled for your website:
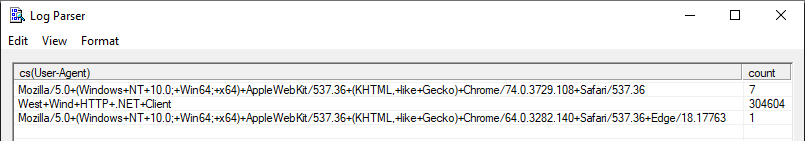
Then you can create some advanced queries. For example, this query can show you the different user agents in all of the log files of a website hosted by IIS:
SELECT cs(User-Agent), count(*) as count
FROM C:\inetpub\logs\LogFiles\W3SVC1\u_*.log
GROUP BY cs(User-Agent)
You can execute the following command to use this query:
LogParser file:"query.sql" -i:W3C -o:DATAGRID
I set up a local website and executed some requests using two browsers and a load testing tool. This is the result:
This is a powerful way to get ad-hoc statistics from your IIS logs: performance, user agents, HTTP response codes, IP addresses, requested addresses, etc. There’s a lot of data to be extracted from IIS logs. Unfortunately, it’s a bit of a hassle to execute your favorite queries every time you want to get some insights. Log Parser has no concept of a dashboard to take a quick glance at the status of your application. But there are other tools that provide you such features.
Log Parser Input Formats
In the above query, it seems we selected certain columns from an “Application” table in some database. However, this “Application” points to the Application log of the Windows Event Log. In fact, this is what Log Parser calls an Input Format.
Log Parser has several Input Formats that can retrieve data from
- IIS log files (W3C, IIS, NCSA, Centralized Binary Logs, HTTP Error logs, URLScan logs, and ODBC logs)
- the Windows Event log
- Generic XML, CSV, TSV and W3C formatted text files
- the Windows Registry
- Active Directory Objects
- File and Directory information
- NetMon .cap capture files
- Extended/Combined NCSA log files
- ETW traces
- Custom plugins
In some cases, Log Parser can determine the Input Format for you. In our example, the tool knows that “Application” is an Event Log Input Format. Similarly, Log Parser knows which Input Format to choose when you specify an XML or CSV file.
If Log Parser can’t determine the Input Format, you can specify it with the “-i” option:
LogParser -i:CSV "SELECT * FROM errors.log"
In this case, Log Parser will query the “errors.log” file using the CSV Input Format.
To see a complete list of all of the possible Input Formats, consult the help file (“Log Parser.chm”) that you’ll find in the Log Parser installation directory.
Log Parser SQL
Internally, Log Parser uses a SQL-like engine. This gives us the possibility of using SQL to query the logs. I say SQL-like because there are certain functions that aren’t standard SQL. For example, the REVERSE DNS(<string>) function will return the corresponding hostname of an IP address.
There are many functions that can make your life easier. It’s too much to mention them all in detail here, but you can find them in the Log Parser help file.
Log Parser Output Formats
Once you have a query with some results, you’ll probably not want to keep writing the output to the command-line. Collecting and parsing logs is usually the first step of a bigger process. You might want to run some operations on them, get stats, or send them to a dashboard for analysis, etc. And different use-cases might require different formats of data. Log Parser supports several Output Formats:
- Text files: CSV, TSV, XML, W3C, user-defined, etc.
- A SQL database.
- A SYSLOG server.
- Chart images in GIF or JPG format.
To write the results to a file, you can simply add the “INTO” clause to your query. To continue with our example, this query will write the results to a CSV file:
SELECT QUANTIZE(TimeGenerated, 86400) AS Day, COUNT(*) AS [Total Errors]
INTO results.csv
FROM Application
WHERE EventType = 1 OR EventType = 2
GROUP BY Day
ORDER BY Day ASC
Just like Input Formats, Log Parser is smart enough to use the correct Output Format in some cases. In our example, the file had a CSV extension. So it makes sense to use the CSV Output Format. If you want to specify the Output Format, you can do so with the “-o” option:
LogParser file:errors_by_day.sql -o:DATAGRID
This will open a window with a data grid:
Log Parser Studio
Log Parser Studio is a GUI on top of Log Parser. It contains many default queries that you can modify to fit your needs:
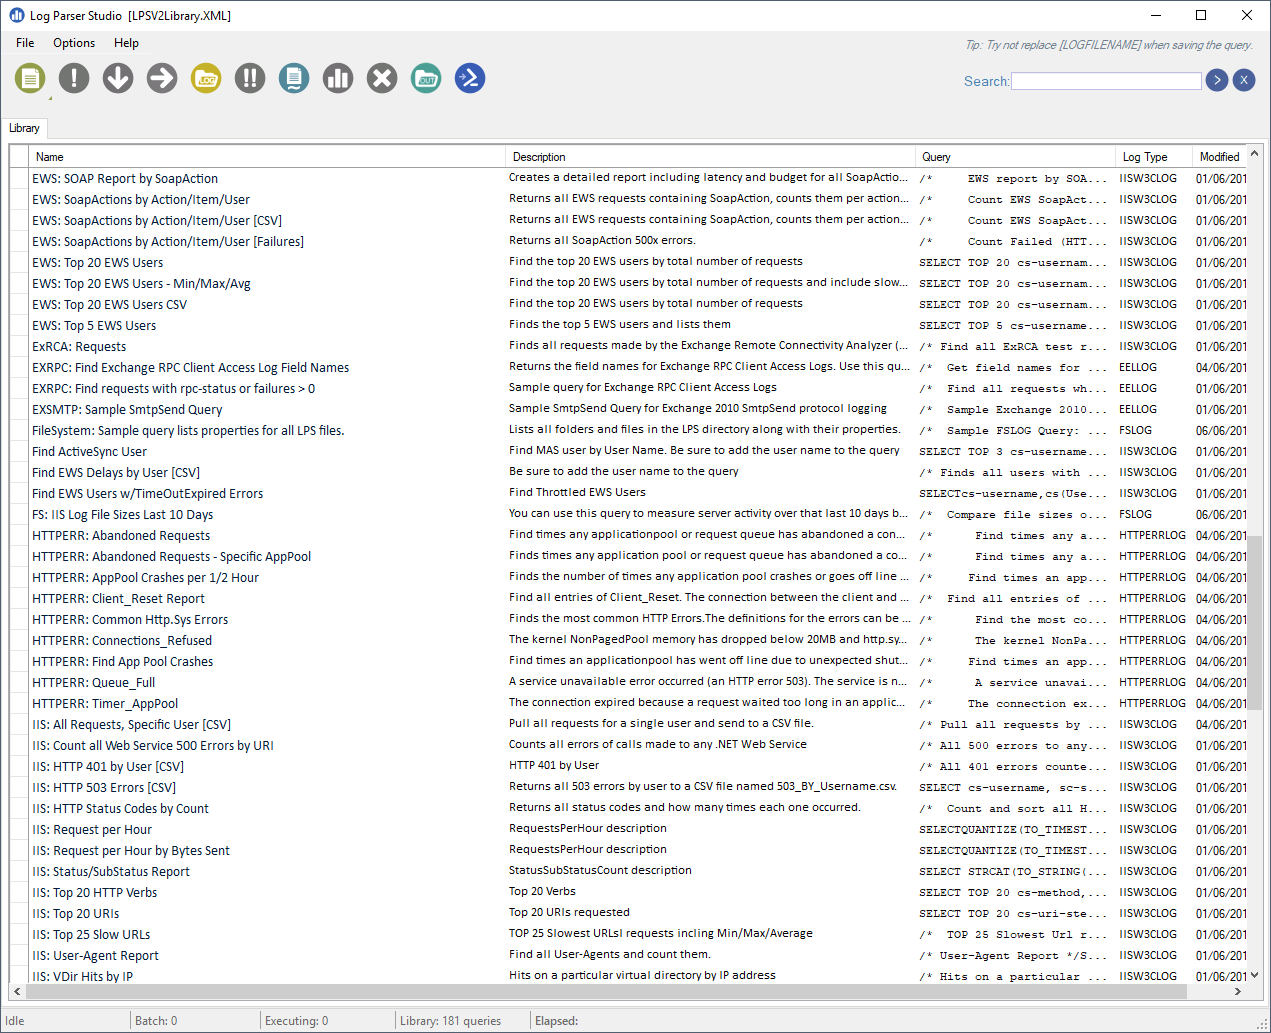
If you’re only getting started with Log Parser, it can be a more convenient way of parsing your logs.
Caveats
Log Parser is a powerful utility that’s not very well-known. It comes with complete documentation in the form of a classic Compiled HTML Help file. This shows its age. The latest version dates back to April 2005.
Another potential issue is that the Output Format that produces images of charts requires Microsoft Office Web Components (OWC). However, OWC is only supported up until Office 2003. Even the extended support has been dropped for some time now.
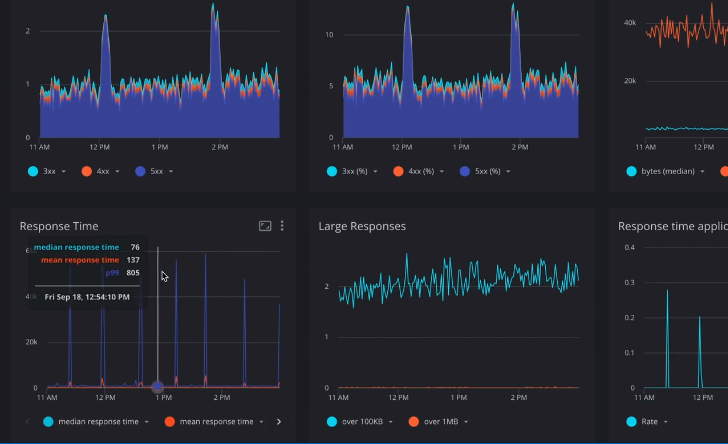
And while Log Parser still works perfectly, it isn’t ideal for the professional user that needs to check logs regularly, wants an easy overview of what’s going on, and needs to pinpoint problems quickly. It’s more of a tool that you can use to write specific queries for specific information that you need at a certain point in time. If you need dashboards and overviews, quick access to detailed information that you need often, or ease-of-use for less tech-savvy people, Log Parser is limited. In such a case, take a look at Scalyr. It supports custom queries and monitoring Kubernetes.
Scalyr does what Log Parser does, and more, but in an easier and more modern way.
Working with logs can get messy because it’s a lot of raw data. But they are a rich source of information. In order to make the best out of them, you need powerful features. And DataSet comes with a bundle of them:
- Fast ingest and search
- Embedded Metrics and Visualizations
- PowerQueries
- Real-time alerts
- Live tail
- Security and reliability and much more…

