
I think you’ll agree with me when I say that a database is one of the most important components of almost every application today. When working with databases, you have to take care of a lot of things. Some examples include designing and creating the database, maintaining it, managing backup and recovery, and measuring performance. And in this post, I’m focusing on the performance part.
Performance is always linked with time. The faster your database is, the higher it’s performing. When it comes to databases, the interaction always happens with queries. So to measure the performance of your database, you have to measure the query time. And that’s what I’ll be talking about in this post.

Why Measure Query Time?
When you have an application that uses a database, the application executes database queries to interact with the database. These queries can be from the admin or from your customer’s side. Each of these queries takes some time to be executed by the database management system (DBMS). To optimize the performance, you have to make sure that the queries are being executed as fast as possible.
Measuring the query time helps you understand the time taken by the query to execute. Once you know this, you can decide which query is eating up the time and then work on optimizing it. Basically, measuring query time is the first step in the database optimization process.
In this post, I’m focusing on measuring MySQL query time because MySQL is one of the most used database management systems. So let’s look at a couple of ways to measure it.
How Do You Measure MySQL Query Time?
You will find different ways on how to do this. What is best for you depends on your use case. In some cases, measuring the query time for one or a few cases is enough for you. And in other cases, you’ll have to do it for a huge number of queries. To make sure this post caters to both these types of requirements, I’ll tell you how to measure query time for each of these.
Measuring MySQL Query Time for Single Queries
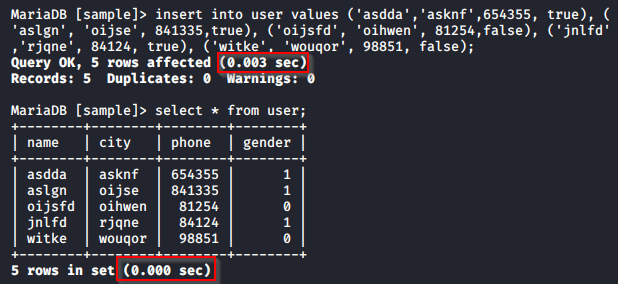
MySQL by default shows the time taken by the query to execute. Whenever you run a valid query, you will see the time of execution in seconds. Here’s a screenshot of the time after I executed a few queries.
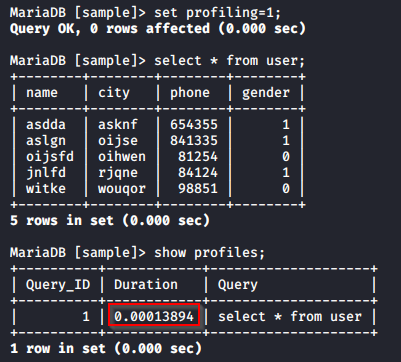
But this won’t be very helpful when you are using a server-side program to execute the query. In that case, you can use the profiler to measure the query time.
The first thing to do is to initialize the profiler using the below query:
set profiling=1
Then you can execute whatever query you want to measure the execution time for. Once executed, you can check the query execution time using the below query:
show profiles;
You will be able to see the duration of query execution in seconds.
These ways are fine when you want to measure the query time for one or a few queries. But this is not practical when you want to measure the query time for a large number of queries. For instance, if you have a deployed application and users are continuously making database transactions using it, it’s not practical or possible for you to record these queries and run them one at a time to measure the query time. You would need something that works for a large set of queries and that is also scalable.
So let me tell you how to measure the query time in such situations.
Measuring MySQL Query Time Using Slow Query Logs
MySQL allows you to log slow queries so that you can examine them later for optimization. So instead of logging all the query details, you just log slow queries. This saves a lot of memory because you’re only logging what matters. But how does the system know that the query is slow? You will have to tell that to the system by assigning a value to the long_query_time variable. So, if you assign the value “2” to this variable, every query that takes more than two seconds for execution is logged.
Let me show you an example of how you can configure MySQL to log slow queries.
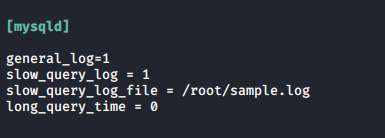
First, you’ll have to enable slow log query for MySQL DBMS. To do that, add the following line in the MySQL configuration file:
slow_query_log
You can also mention the name of the file where the log should be stored by adding the following line:
slow_query_log_file=<path of the file>
Then add the long_query_time value. If you want to log all the queries, you can set this value to 0.
long_query_time=0
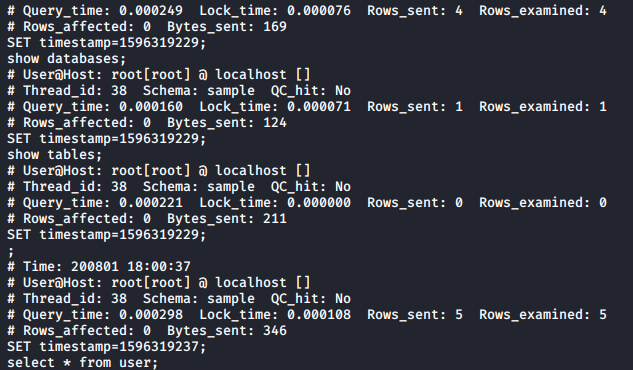
Now, whenever any query is executed, its details are stored in the log file. I’ve run a couple of simple select queries, and after that my log file looks something like this:
Logging details of all the queries will unnecessarily consume memory. To save that memory, you will have to decide on a value for the long_query_time variable. You can decide this by referring to benchmark query execution time for your use case.
Using logs to measure query time gives you a lot of information and is really helpful when you want to measure query time for a huge number of queries. But these logs are in raw format. Going through these logs to find the data that will be valuable for you can get frustrating. You can obviously run this log file through a parser to fetch just the important details. But that’s again an additional task.
If you are looking for a quick solution to measure MySQL query time without putting in a lot of effort, you can use readily available log management tools.
Measuring MySQL Query Time Using Scalyr
Scalyr is one such log management tool that helps you handle logs easily. What’s good about Scalyr is that, along with recording the logs, it also visualizes them for you. Now, let me show you how Scalyr makes things easy for you.
First, you will have to log in to or sign up for Scalyr. Once done, install the Scalyr agent on the system that’s running the MySQL server. You can find the instructions here. This agent will upload your logs to your dashboard so that you can easily view them.
To start logging MySQL query logs, open the terminal and then open the /etc/scalyr-agent-2/agent.json file. Then add the DBMS username and password under the monitor section as follows:
monitors: [
  {
     module:            "scalyr_agent.builtin_monitors.mysql_monitor",
     database_socket:   "default",
     database_username: "USERNAME",
     database_password: "PASSWORD"
  }
]
After configuring the file, start the agent by running the following command:
sudo scalyr-agent-2 start
Now, go to the Scalyr dashboard menu and select MySQL. You will be able to see the log details of your MySQL, which includes the query time.
This is a very simple and easy way to measure query time for a large number of MySQL queries.
The Best Way
I believe that the best way to measure query time is by using tools like DataSet. It not only gives you the information that you need but also brings it to you in an easy-to-understand form. You don’t have to get frustrated looking at the raw log files anymore. To experience what I’ve talked about, you’ll have to see it for yourself. So go ahead and give it a try. You can get a free trial here.

