
Working in infosec and supporting clients and SOCs has always exposed me to a huge number of alerts and incidents. Some of these are more interesting than others. Recently we stumbled across a particular sample of Smoke Loader malware. Smoke Loader has been in-the-wild since circa 2013 and is often used to distribute additional malicious components or artifacts. While the sample is not new, it did prove to be a good opportunity to revisit this threat and walk through some of the internals.

This alert was raised against a suspicious file, classified as a trojan, that was killed and quarantined. What raised my curiosity was the number of detections over only a few hours, always from the same workstation, and only from the same user.
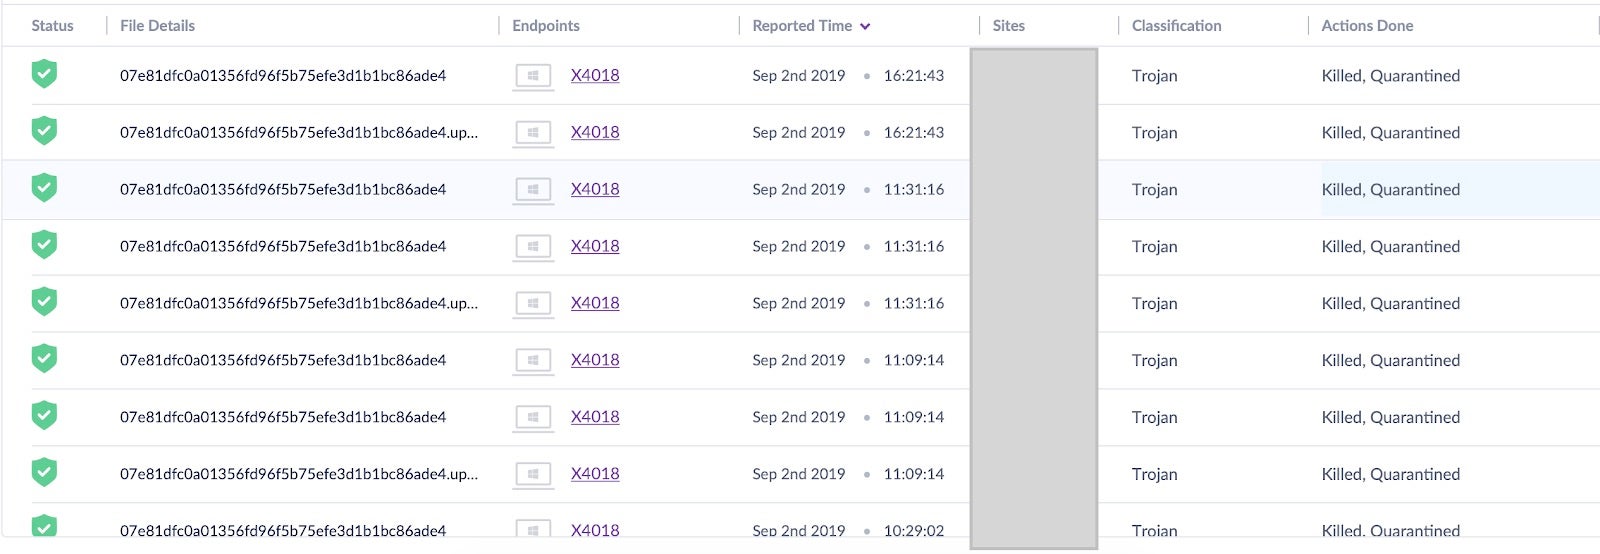
Knowing that the threat was killed without doing any harm, I decided to dig into it a bit more. Just looking at the SentinelOne console, I was able to see :
- The full path where the detection was made.
- The associated risk level is High: this implies that it’s a positive detection.
- File unique hash that can be tested for any public Indicators of Compromise (IoC).
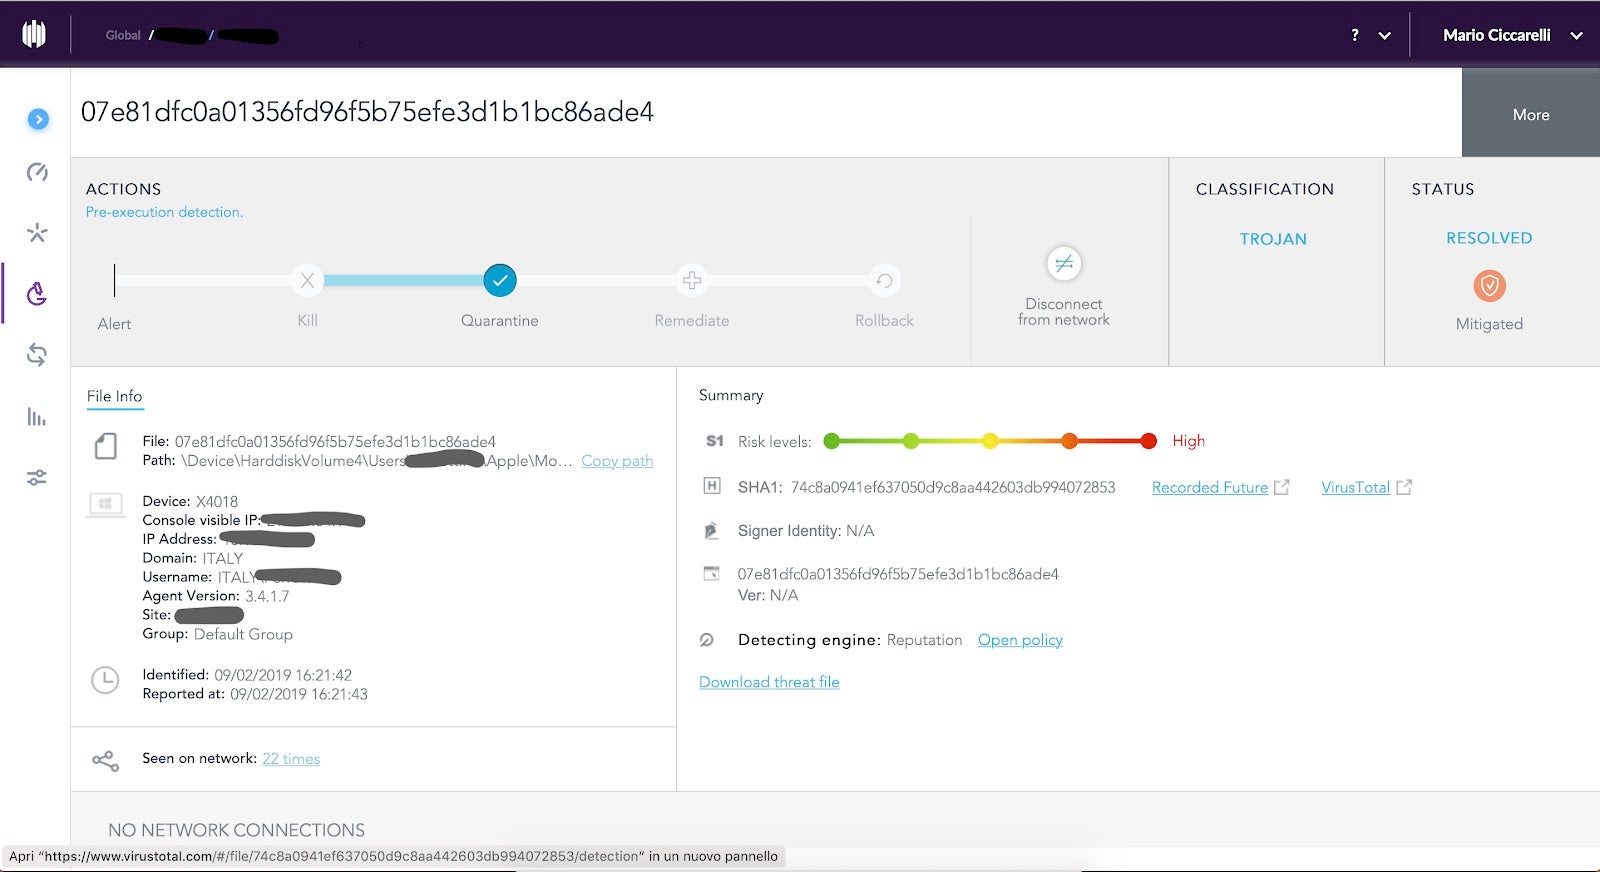
In order to do a walk-through of malware reverse engineering steps, I downloaded the threat file and started the analysis.
First Layer: A Packed VB Win32 Program
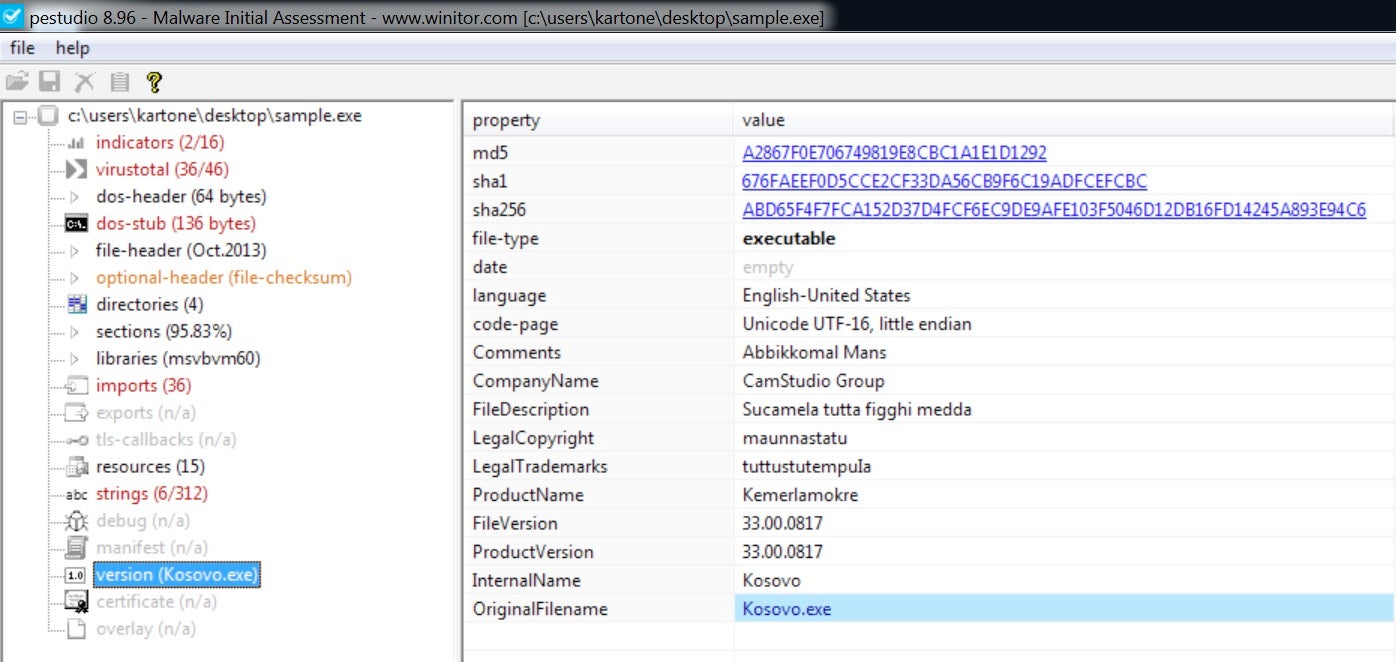
With the downloaded file in my pocket, I quickly fired up an isolated analysis machine equipped with the Flare tools and started to investigate. At first glance, the sample appears to be a Visual Basic program leveraging Win32 APIs.
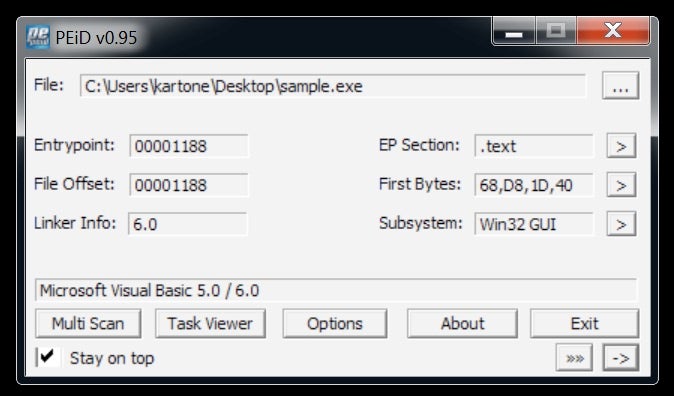
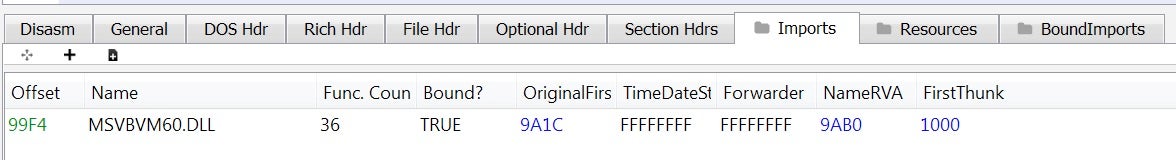
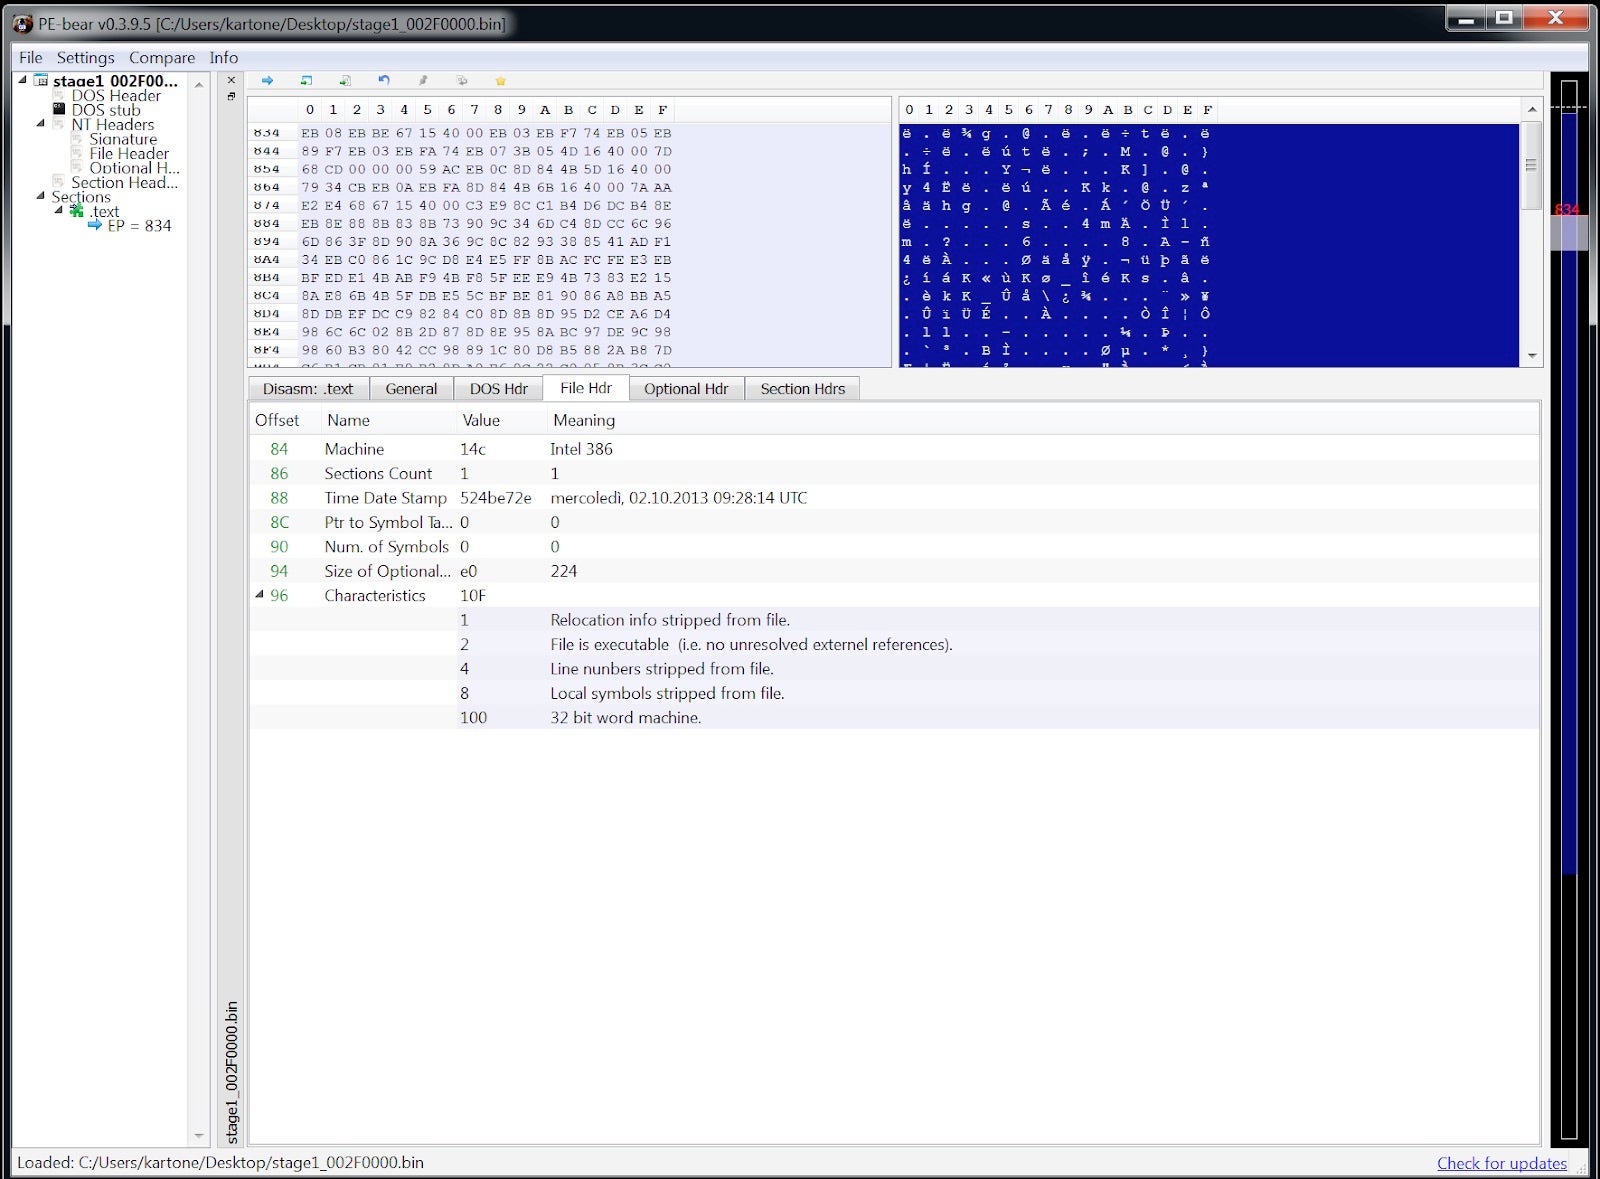
Let’s see what else we can get from its headers. Looks like pretty standard information, confirming a Visual Basic program due to its import table.
We can spot some rude and folkloristic words inside the binary strings, some of which make me think of a regional dialect of southern Italy.
With a bit of experience, we can safely assume that the file is packed with an external layer of Visual Basic that tries to stop, or at least slow down, static analysis. But what about its runtime behavior?
Observing the sample during runtime, we can observe the process injection: this behaviour is common for VB packers and luckily for us, is often trivial to defeat.
Defeating Visual Basic Packer
We won’t spend too much time on this: there are plenty of resources on how to unpack such packers and I highly recommend the OALabs Youtube video tutorials. It’s necessary and enough to put a breakpoint at CreateProcessInternalW API inside the debugger to stop the execution at the right time.
![]()
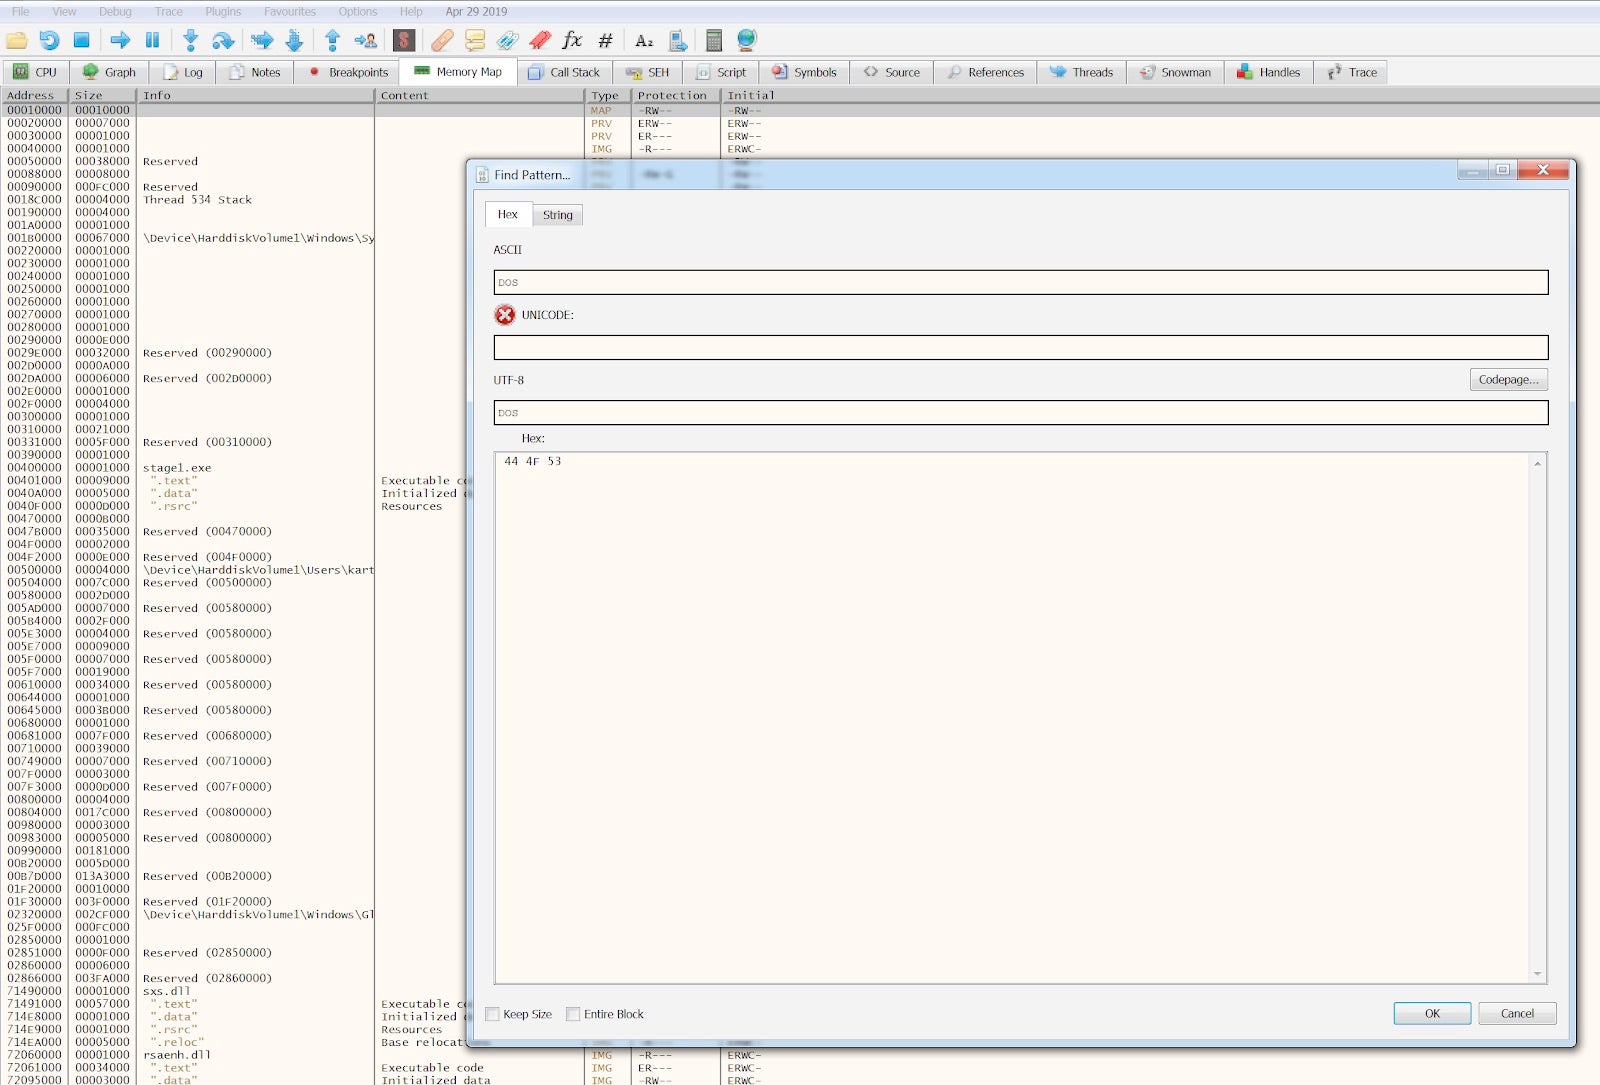
At this point, somewhere in memory, there is a PE file ready to be run. We only need to find it. To do so, we can search the entire memory map for a clue: I decided to search for the “DOS” substring that can usually be found as part of the “This program cannot be run in DOS mode” string within the PE.
We got plenty of results for the string, whose hex is 44 4F 53.
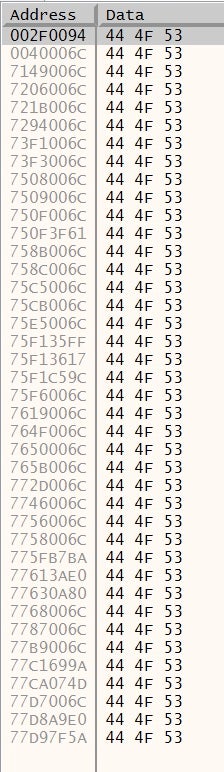
However, we are particularly interested in just a few locations. Usually the executable is loaded at 0x00400000 address, so the result we had at 0x0040006C looks like our executable itself.
Things become particularly interesting at 0x002F0094, which we can follow in the memory dump.
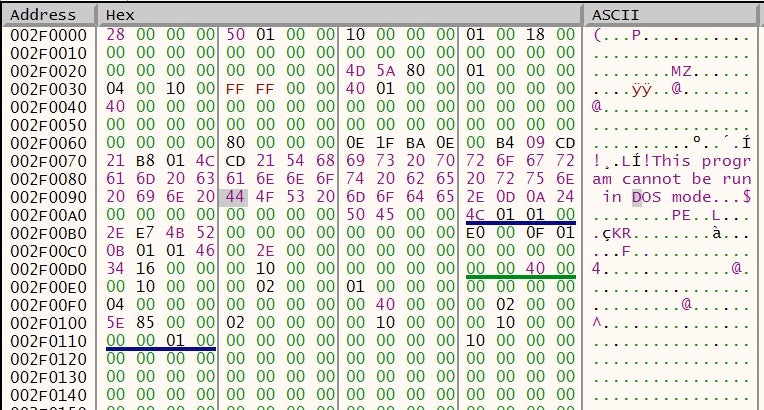
A memory region with a PE file inside, mapped as Executable, Read, Write. This is definitely our injected file.
We can simply dump out this memory region to file, clean the junk before the MZ header and analyze its headers.
It seems like a legitimate executable, but something is going on: no imports at all. This is interesting!
Second layer: Static Analysis
When we load this new executable in IDA Pro, this was the only chunk of code that was disassembled.
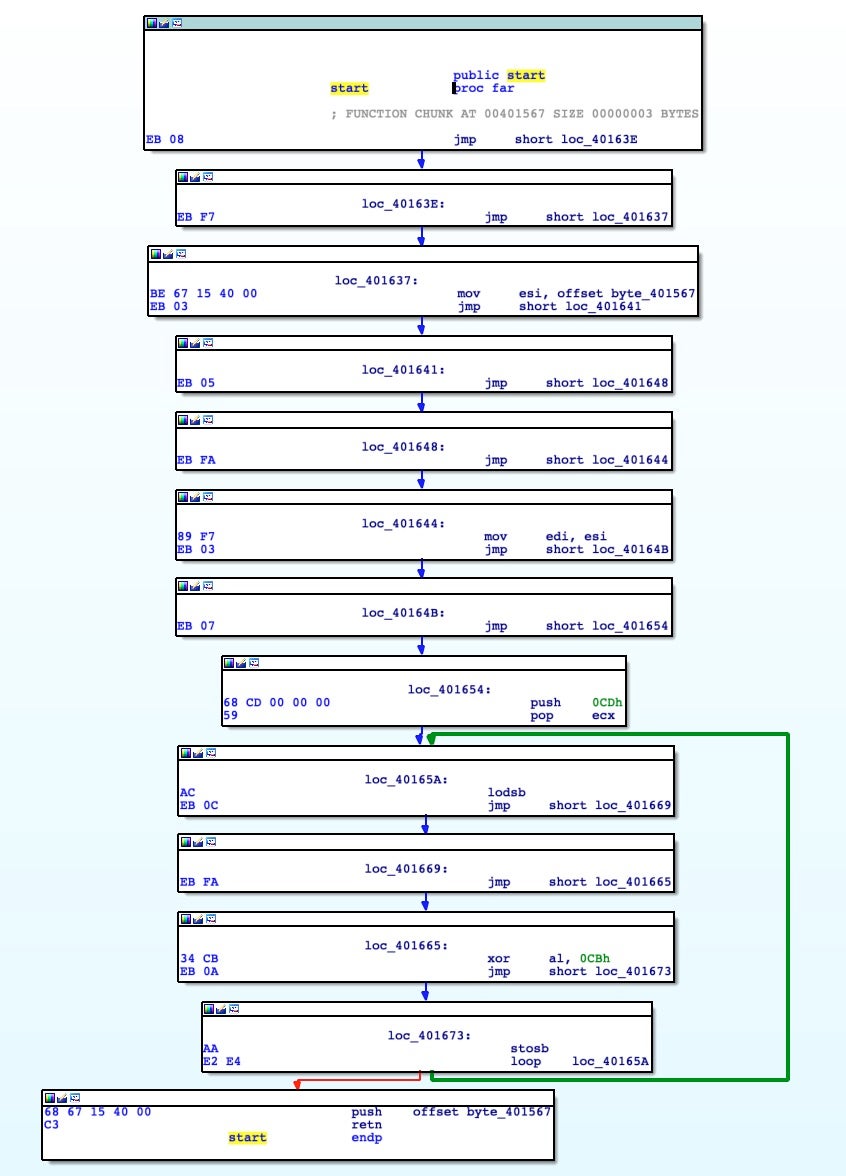
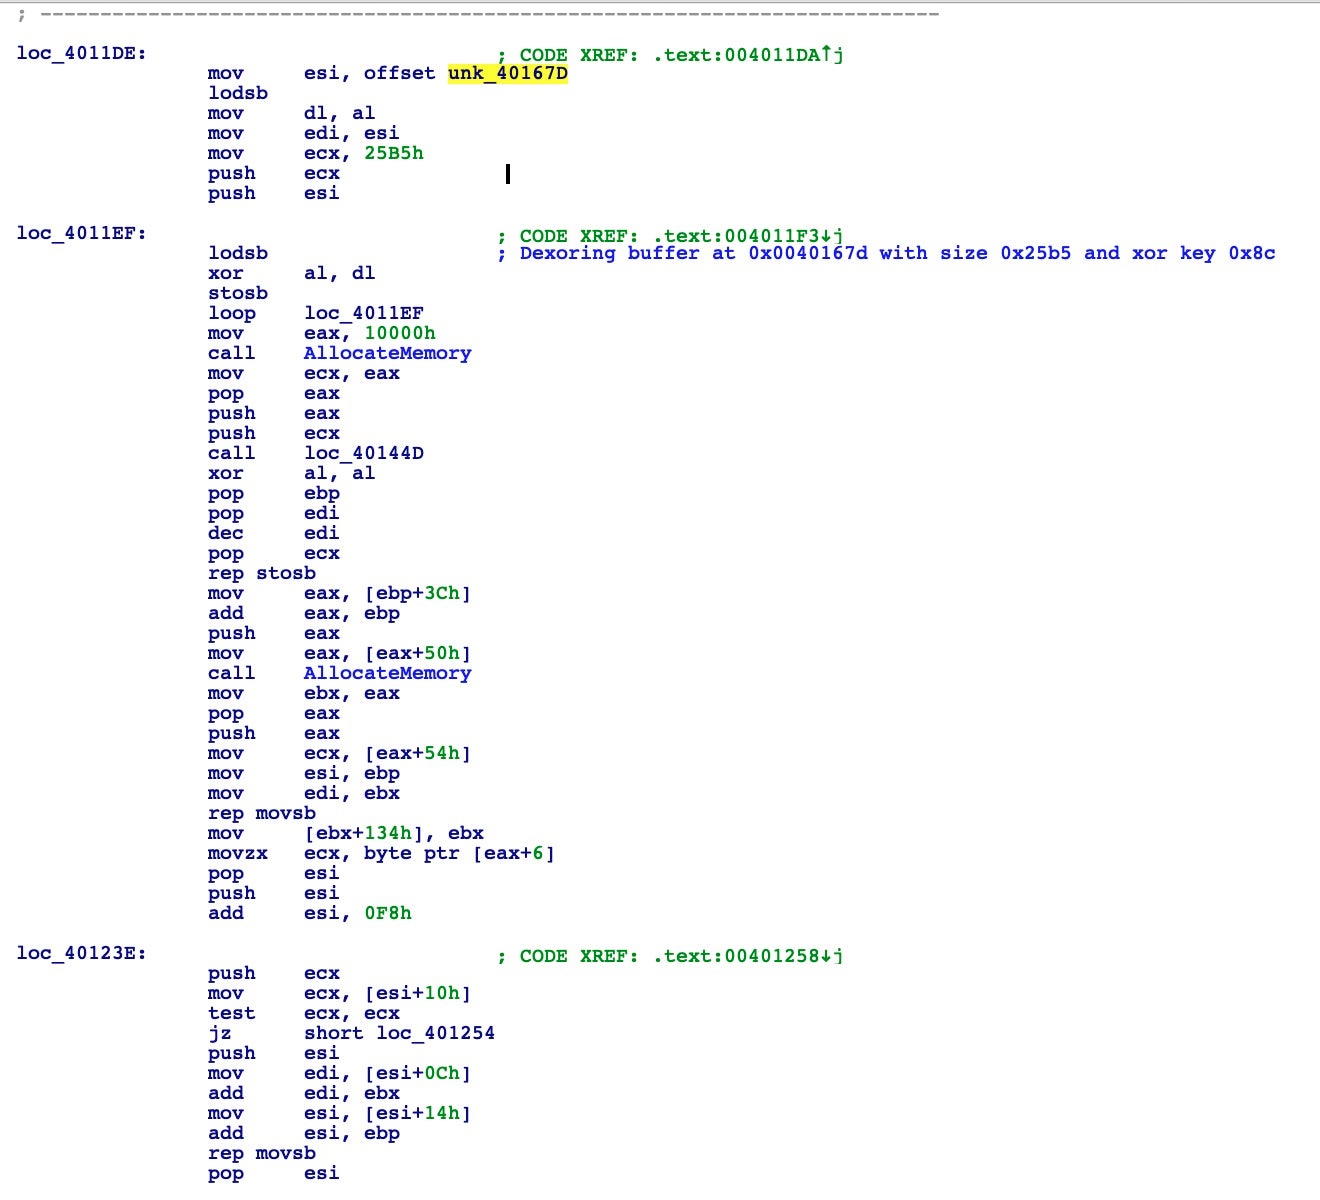
Here we recognize that it’s a XOR loop that will decode, from address 0x00401567, a blob of code with the size of 0xCD bytes with a XOR key equal to 0xCB. At the end of the loop, the same starting address 0x00401567 is pushed onto the stack and with the RET instruction the program flow will be branched over there.
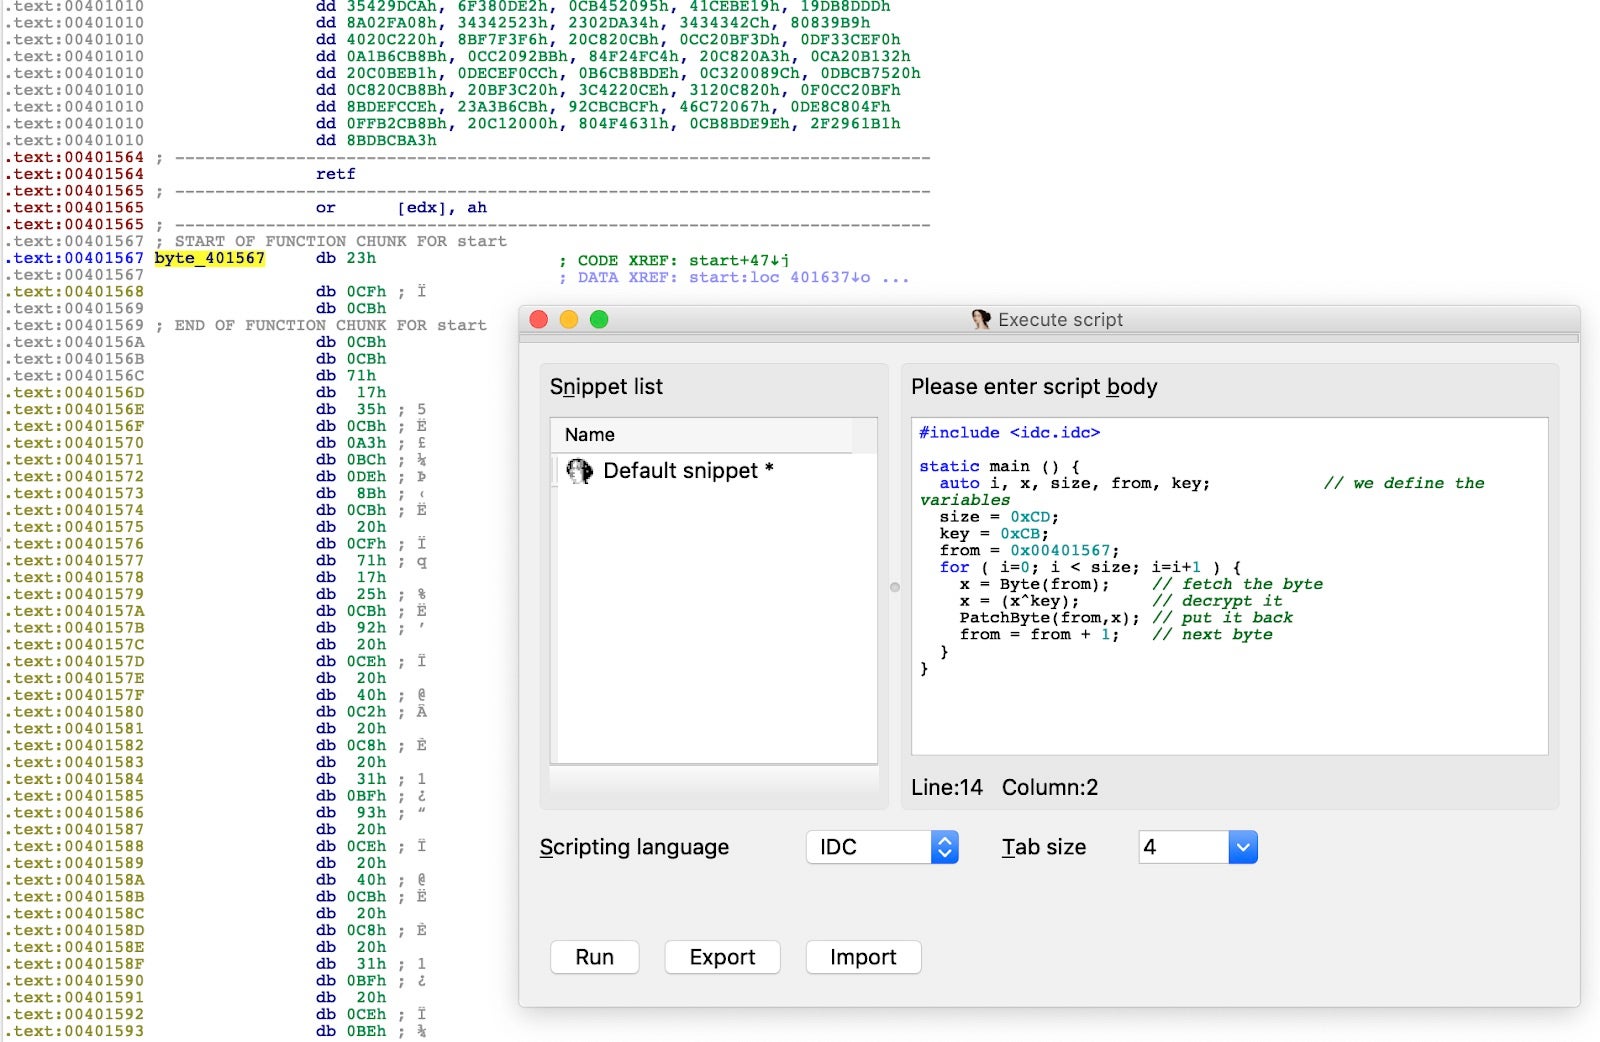
Decoding the Buffer
With a little bit of IDA scripting, we can XOR the encrypted buffer and move forward in the analysis.
After de-xoring the buffer we are met with a mixture of anti-disassembly and anti-debug techniques. It is now possible to map the purpose of the code blocks.
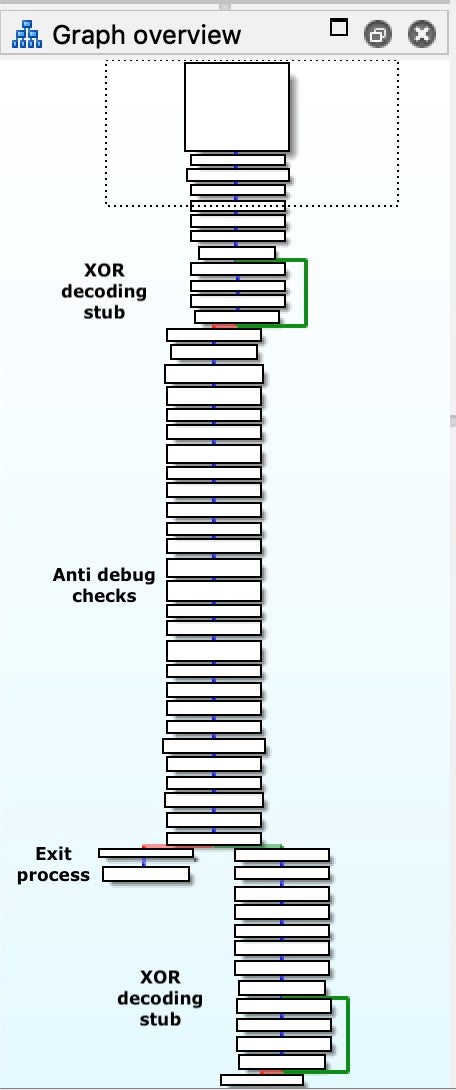
Inside this code, we can observe plenty of tricks that try to fool the disassembly flow. A few examples:
- Abusing CALL and RET instruction to mess up function boundaries. The CALL instruction will push the return address onto the stack. The RET instruction will then pop off this address into the EIP register, which effectively makes these two instructions useless. However, these few opcodes make IDA think that the function ends there and that the next instruction is the end of another function.
- Abusing branch instructions that do nothing: CALL
<address>and at<address>: POP<reg>. It’s the easiest way to get an address inside the EIP register and so to control the program’s flow. - Abusing JMP instructions: simply putting a lot of JMP instructions that will jump back and forth only to make the life of the analyst miserable.
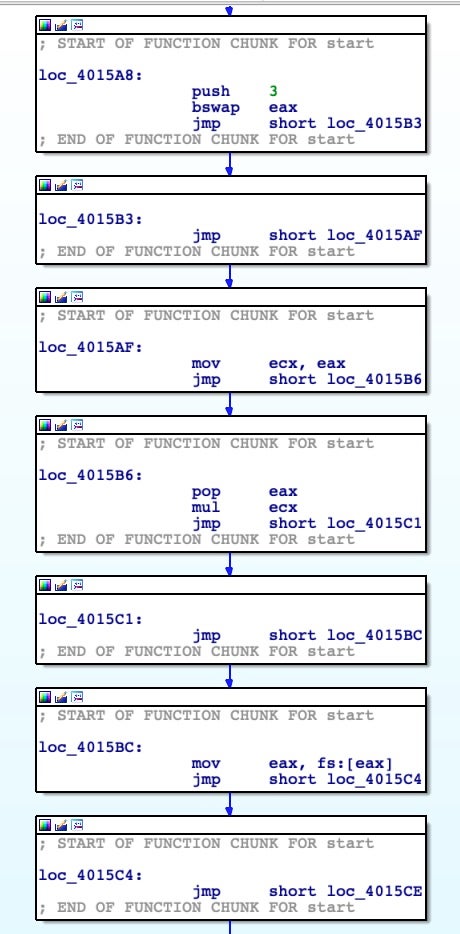
Obfuscated with these techniques, the malware checks if it’s being debugged. The code that implements this check is nothing complicated: it queries certain flags of the PEB in order to spot the debugger, IsDebuggerPresent.
mov eax, fs:[30h] ; Process Environment Block

cmp b [eax+2], 0 ; check BeingDebugged
jne being_debugged
As said, this code is heavily obfuscated with junk jumps and a lot of instructions with the only purpose of increasing complexity of analysis. As an example, this little chunk of code is the final part of a dozen lines of code used to put value 0x30 inside the EAX register with the purpose of locating the PEB.
At the end of this function, we spot another XOR stub decoding routine that will decode another blob of code and, after that, redirect the execution flow. Decoding will start at address 0x004014E8, with a buffer size of 0x7F and the same XOR key 0xCB.
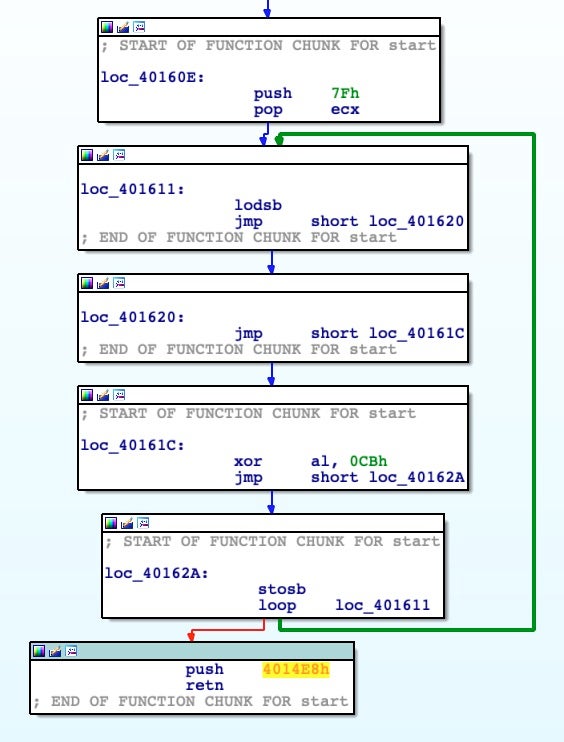
As before, we can proceed in the static analysis, manually decoding this buffer with the same script.
But wait! Here we go again, another anti-debugging trick, NtGlobalFlag check:
mov eax, fs:[30h] ; Process Environment Block
mov al, [eax+68h] ; NtGlobalFlag
and al, 70h
cmp al, 70h
je  being_debugged
This chunk of code checks if the process is attached to a debugger and, if it goes well, another XOR decoding stub starts from address 0x00401000, with buffer size 0x4E8 and XOR key 0xCB.
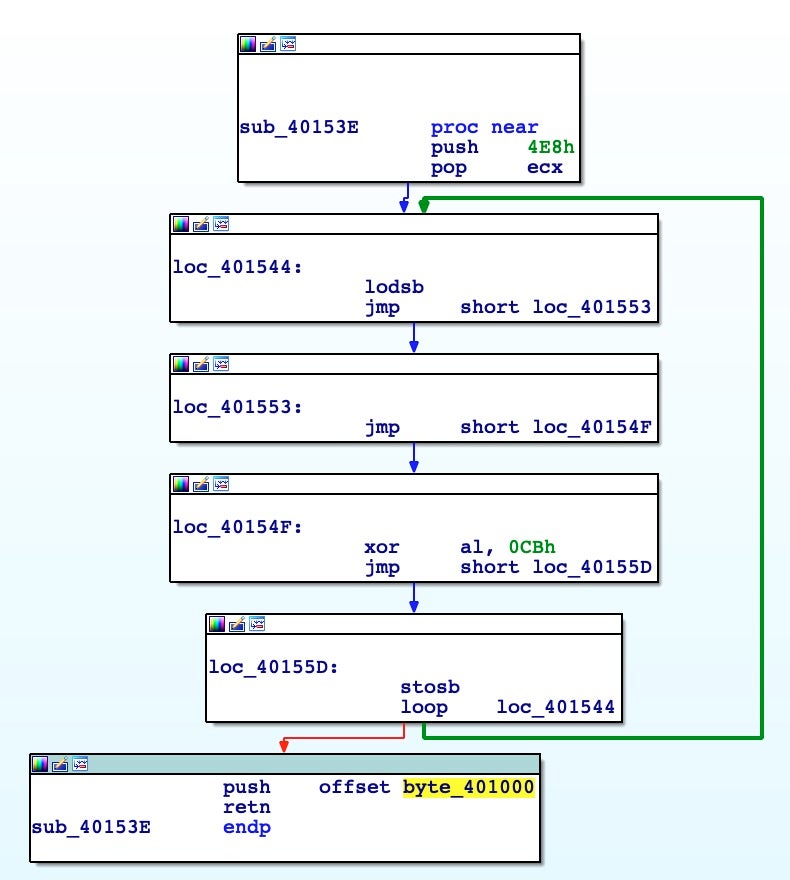
After decoding the new buffer, we need to face another anti-disassembly trick; namely, JMP instructions with a constant value. This is the most common trick used by malware to fool static analysis. Basically, it creates jumps into a new location plus one or a few bytes. It results in an erroneous interpretation of the opcode by the disassembler. It’s trivial to defeat but time intensive.
IAT Resolution at Runtime
At address 0x00401000 there’s a simple call to another address 0x00401049, where it starts to become interesting as the malware appears to dynamically resolve its imports. As we noted before, the binary header analysis showed no imports at all. With this code, from the PEB location found earlier, the malware finds the base address of ntdll.dll.
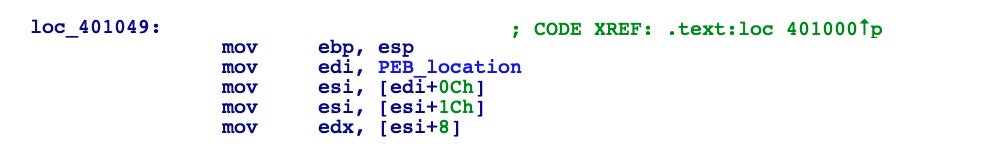
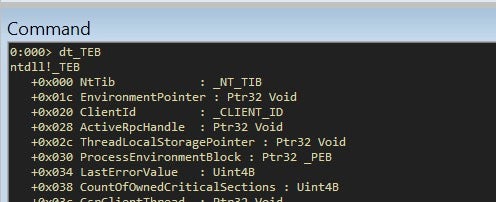
But how is this happening? In all recent Windows versions, the GS register points to a data structure called the Thread Environment Block (TEB). At offset 0x30 of the TEB, there’s another data structure, namely the Process Environment Block (PEB) we saw earlier.
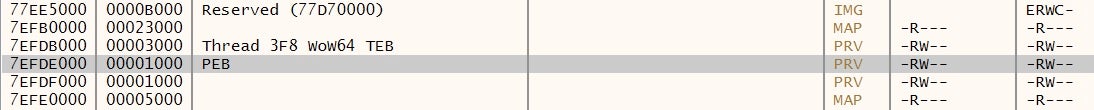
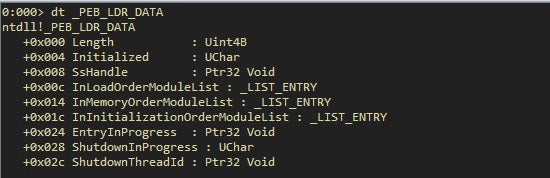
We can inspect these data structures with the help of Microsoft public symbols and WinDBG.
With the same tools we can inspect the PEB too:
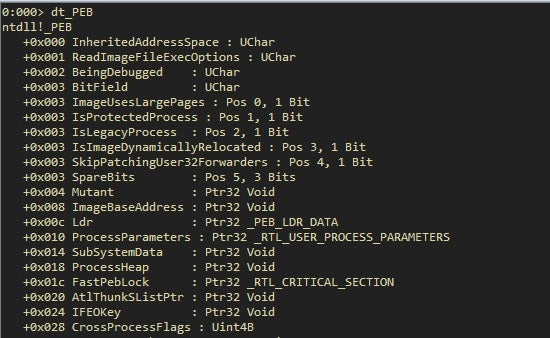
With the third instruction, we are following the offset 0x0C, the _PEB_LDR_DATA structure. This structure is fairly important because it contains a pointer, InInitializationOrderModuleList, to the head of a double-linked list that contains the NTDLL loader data structures for the loaded modules.
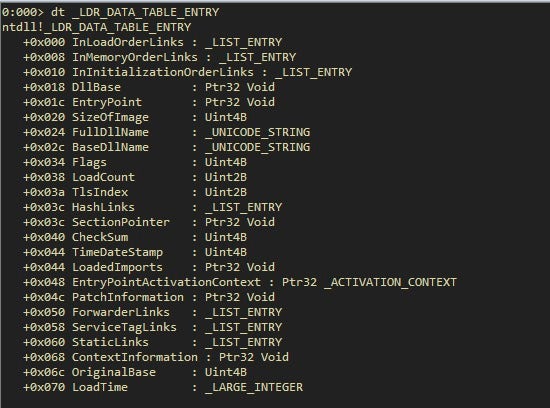
Each item in the list is a pointer to an LDR_DATA_TABLE_ENTRY structure. If we inspect this structure, we get the DLLBase.
Looking at this inside the debugger helps to shed some light:
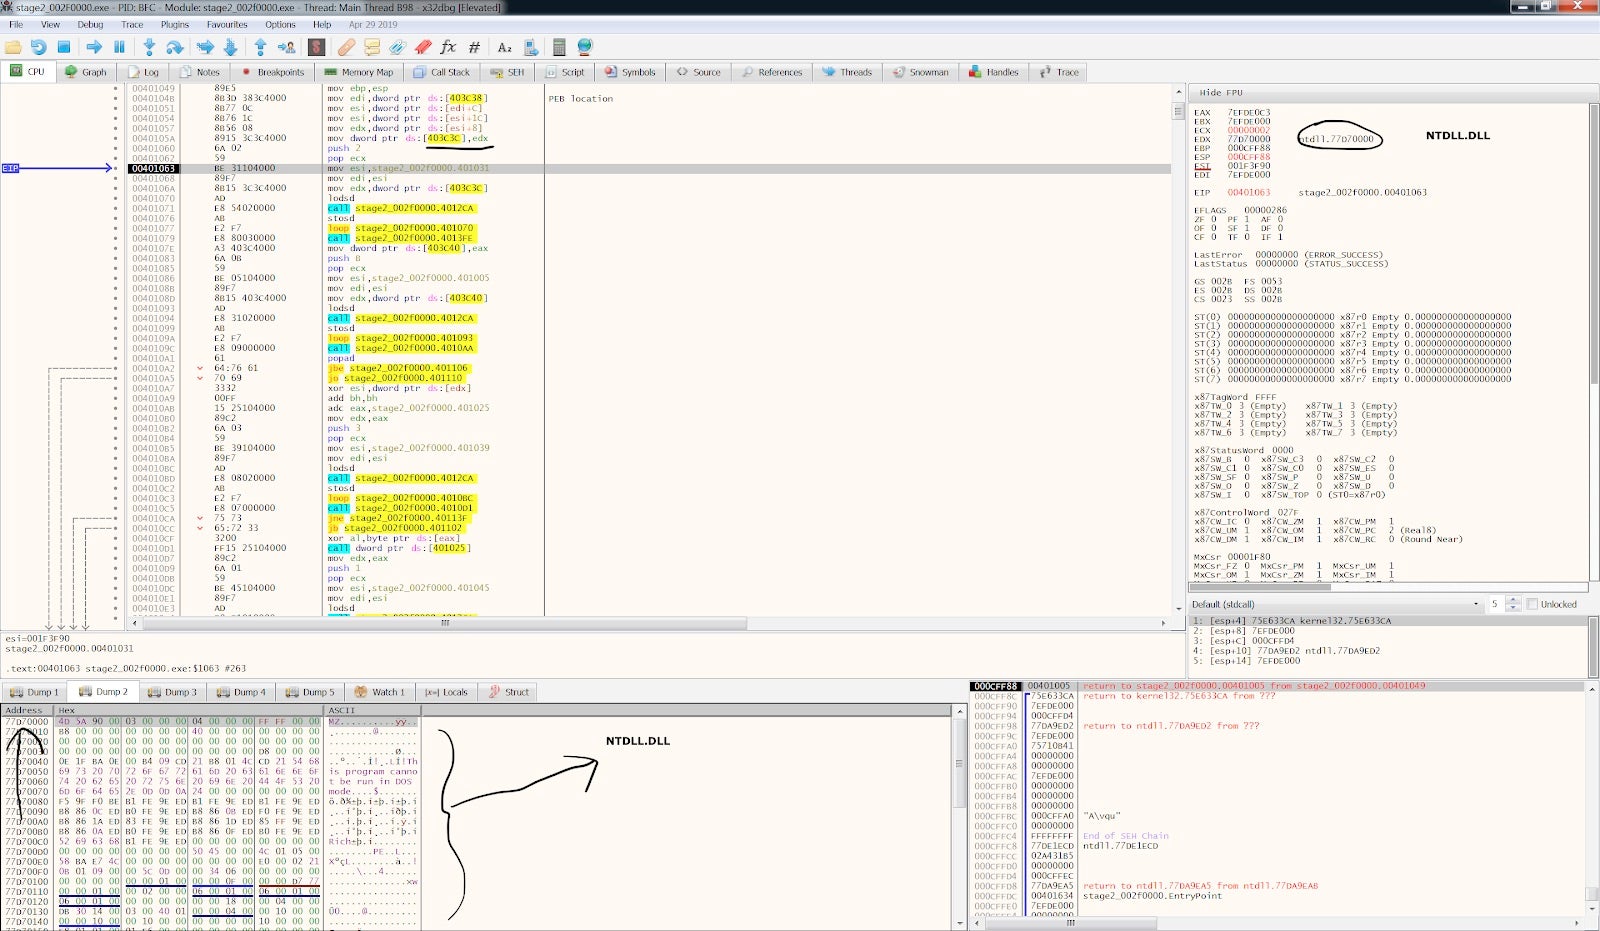
We got the base address of module ntdll.dll into EDX register, because this is the first module loaded into every process in a Windows environment. We have added comments and renamed select functions to clear up some of the observables.
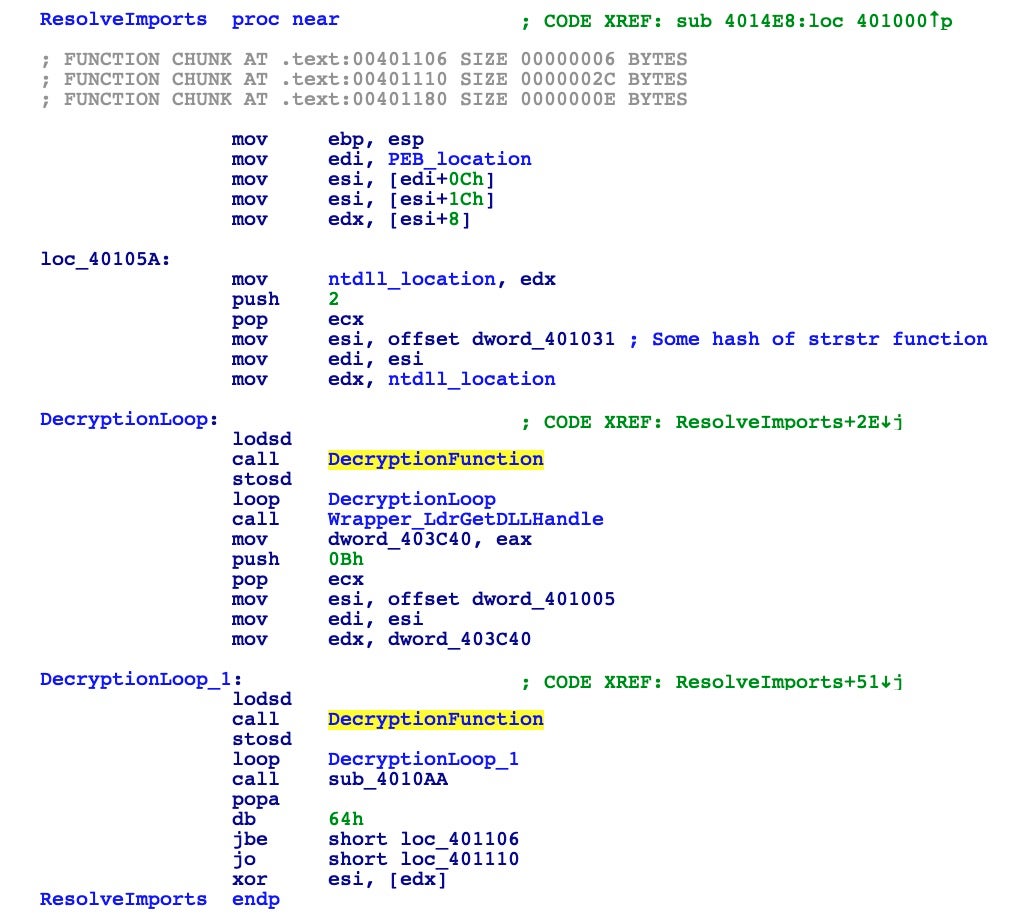
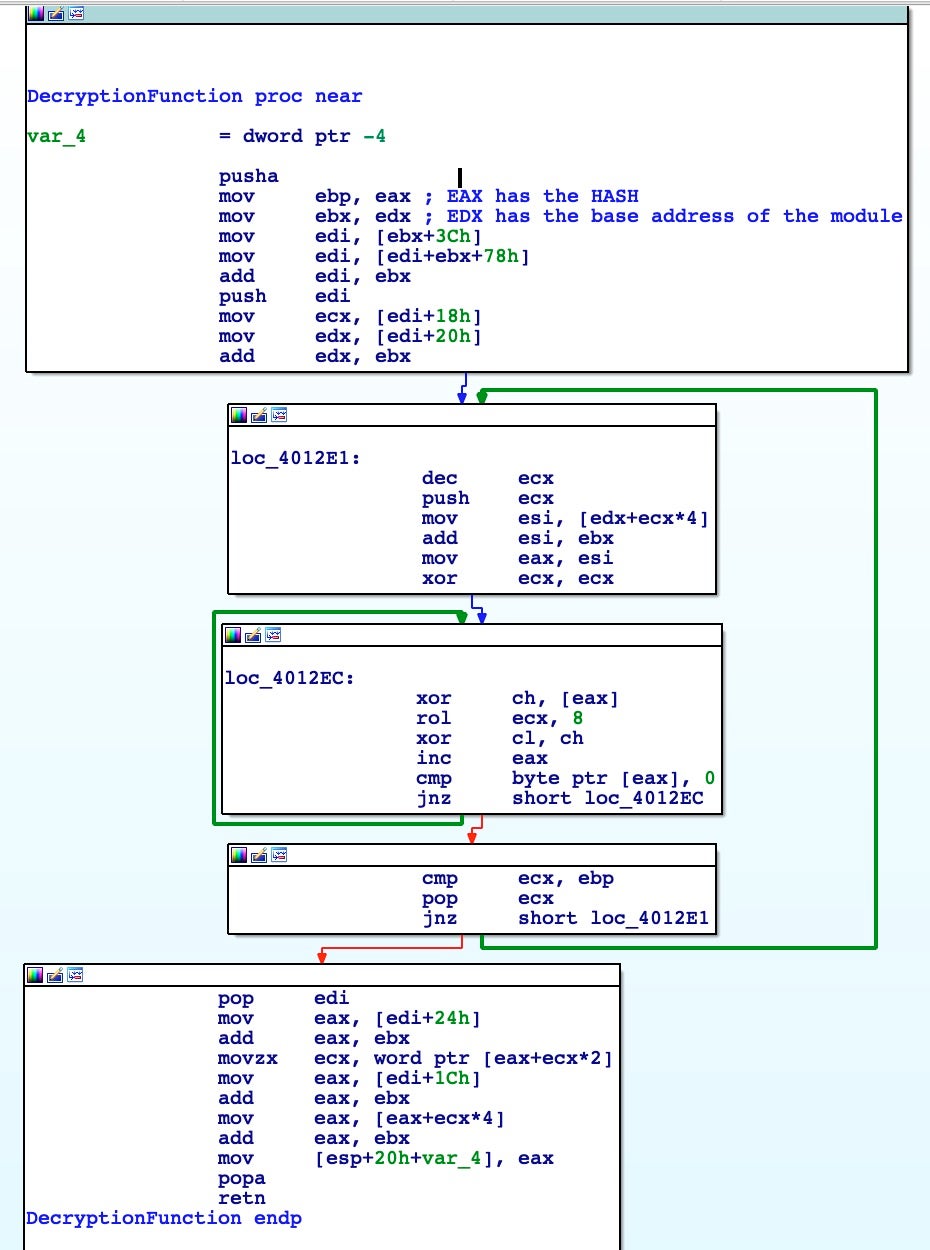
After the malware gets the ntdll.dll base address, it loops twice calling a function named DecryptionFunction. This function receives as input a dword, which here is a hash. As we’re going to see, it will walk the Export Address Table of the module searching for a particular function with the name matching to the passed hash. With this first loop, the malware finds two functions: strstr and LdrGetDllHandle.
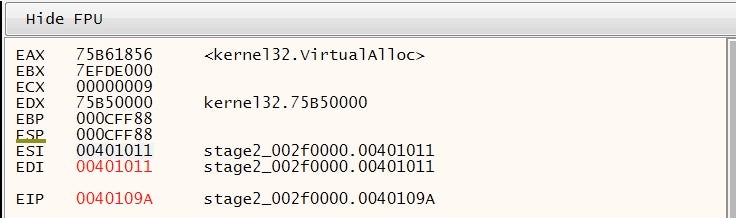
As an example, in this particular case, the DecryptionFunction is walking, as we explained before for ntdll.dll, the module kernel32.dll, retrieving the address of VirtualAlloc put inside the EAX register as return value.
DecryptionFunction
After fully disassembling the function(s) we have the following:
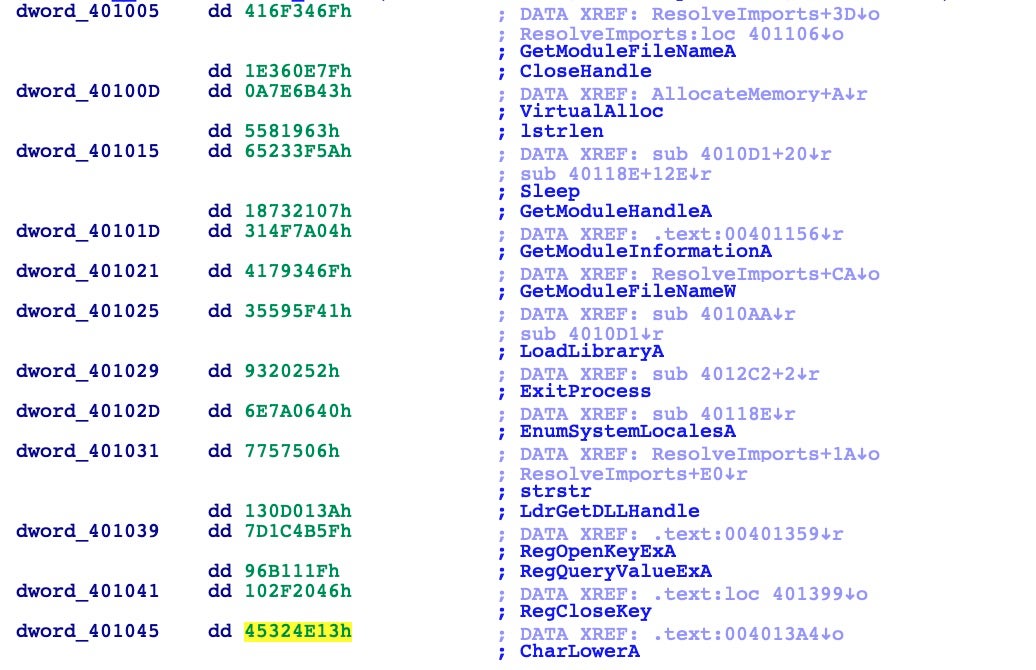
The hashes of the resolved and imported functions appear as follows:
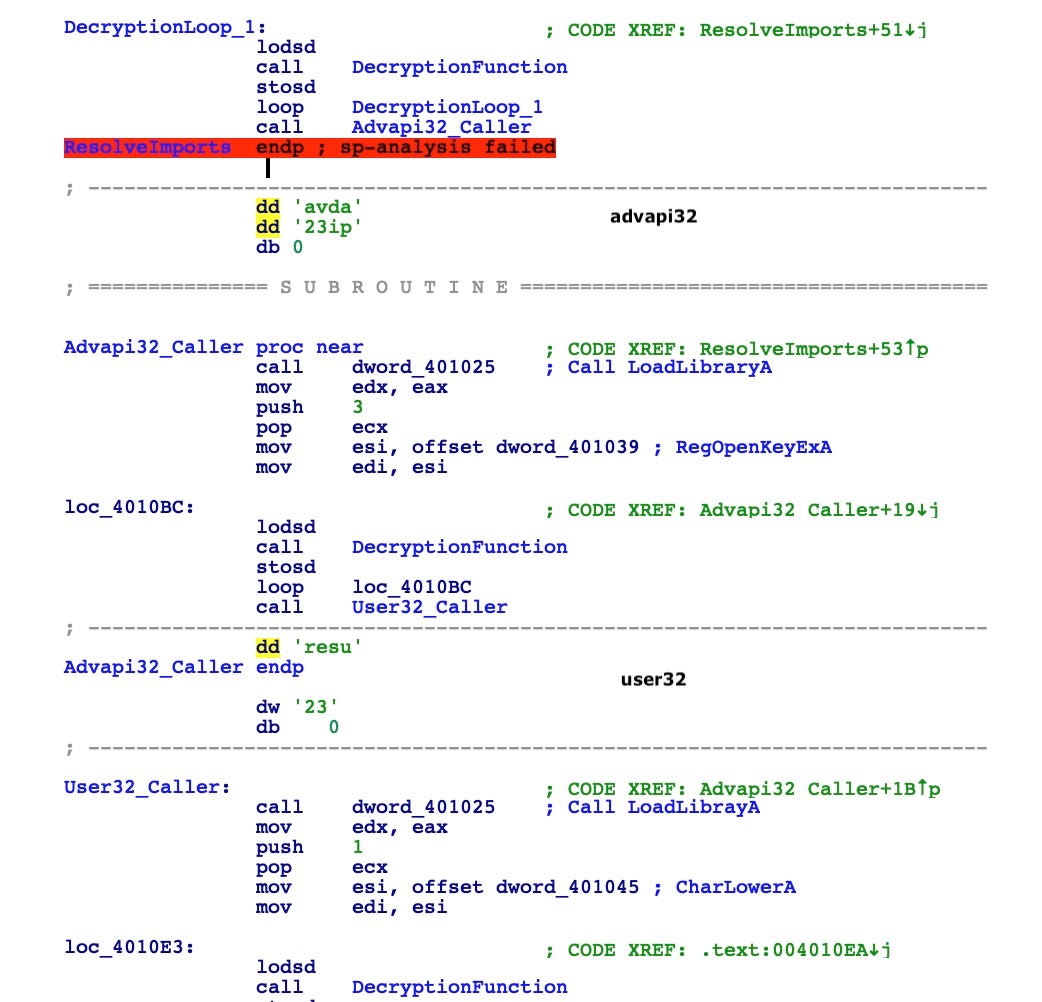
After using the debugger to step into the loops of the DecryptionFunction, we were able to find what functions the malware uses next.
This part of the executable almost works the same way through libraries and functions. I highly suggest looking at the disassembly line by line to understand the inner working of the Windows Internal Subsystem and API calls.
Another interesting trick to be even more stealthy is the use of stack strings to build calls to LoadLibraryA. The secret here is that, by definition, the CALL instruction pushes the next address onto the stack as the return address. But this address is an ASCII null terminated string that will be an argument for the next LoadLibraryA call. Here you can see how it loads two libraries: advapi32 and user32.
Immediately after resolving the imports, the malware sleeps for 10 seconds and then retrieves a filename via GetModuleFileNameA.
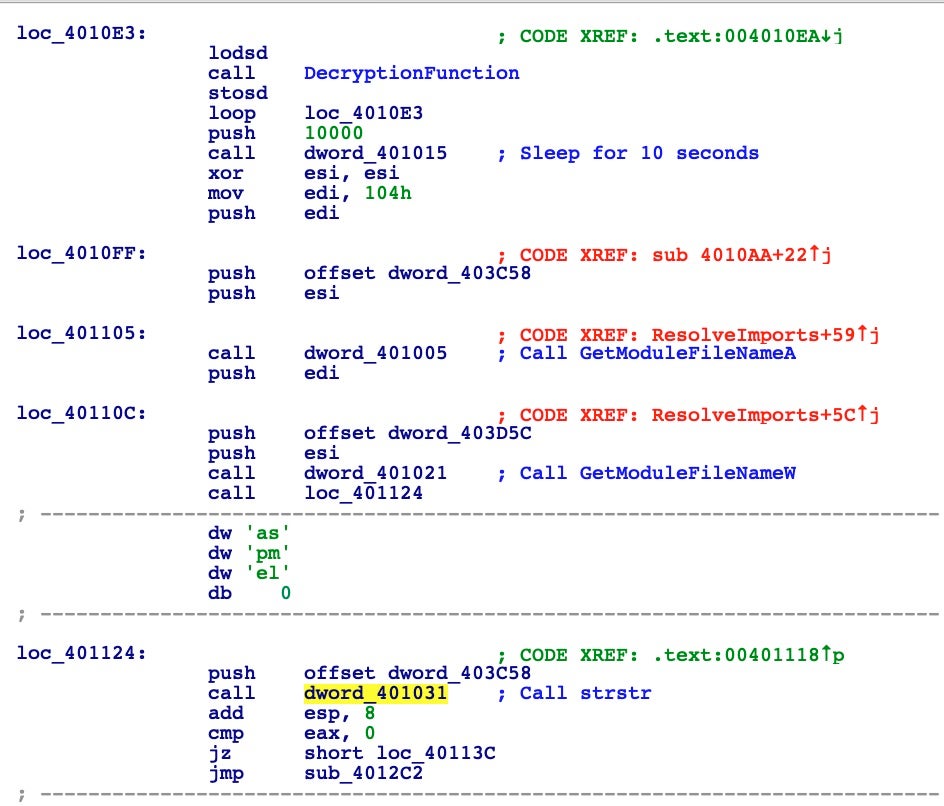
Interestingly, the image above also shows how the code checks if its own name contains the string “sample” and if so consequently terminates itself. You can see how the call to the strstr function is built and how the previous push is given to check for the “sample” string.
It’s a simple anti-analysis technique that might easily catch you out. Protip: do not call your sample “sample”. 🙂
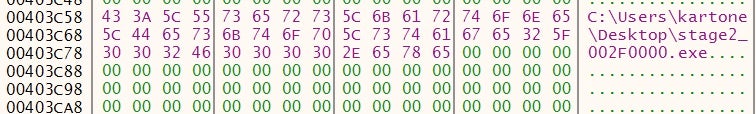
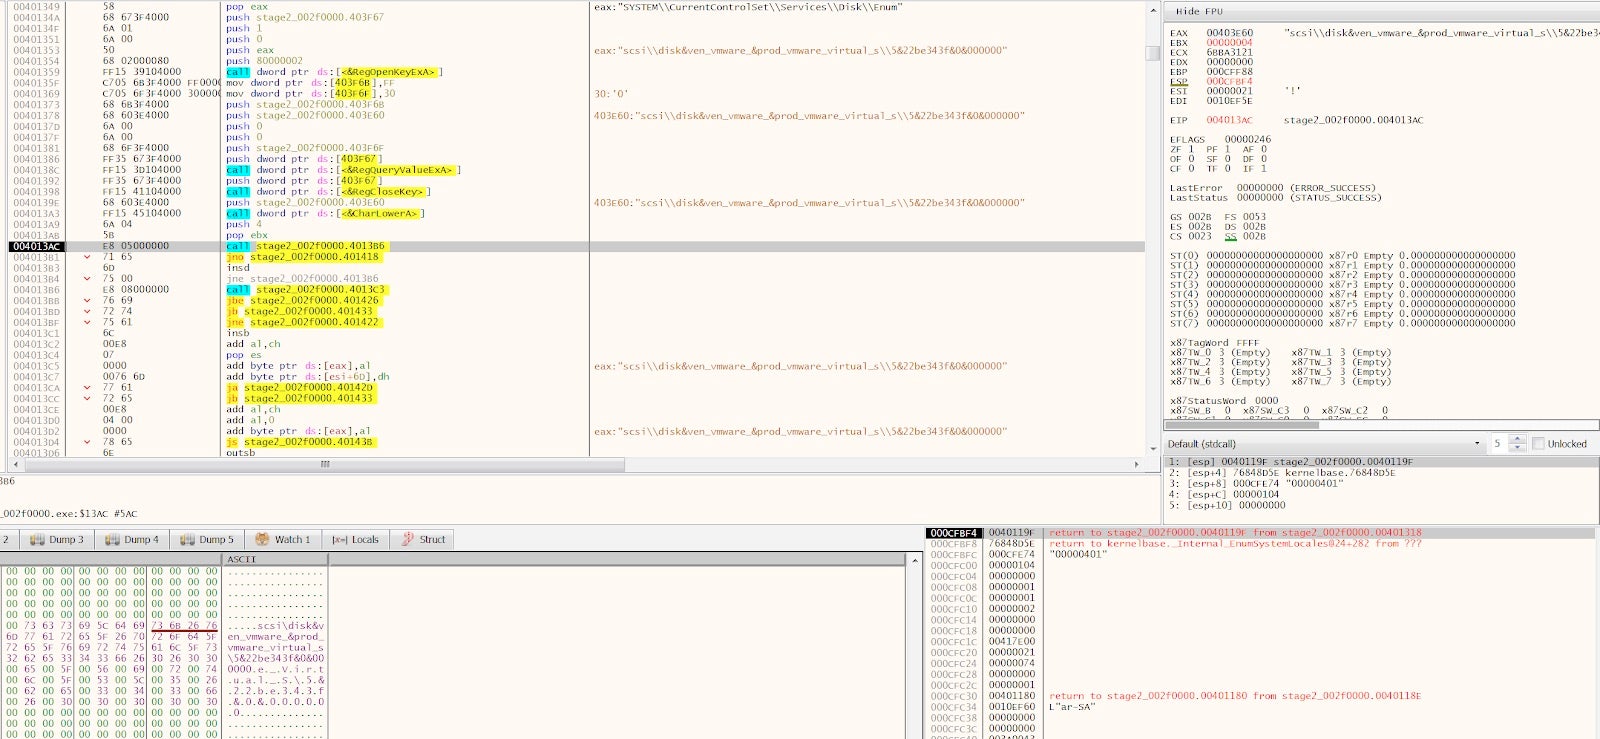
Next, the malware performs another check via GetVolumeInformationA, which is thoroughly documented in MSDN. Let’s look inside this call to understand its purpose.
From the above disassembly, we can see that it retrieves the volume serial number and checks if it’s equal to some two serials. It then opens a registry key with RegOpenKeyExA, pushing one of the arguments with the same CALL technique. It then obtains the value of the registry key, closes the handle, and converts the value to lowercase before proceeding.
It looks clear when you see it in the debugger.
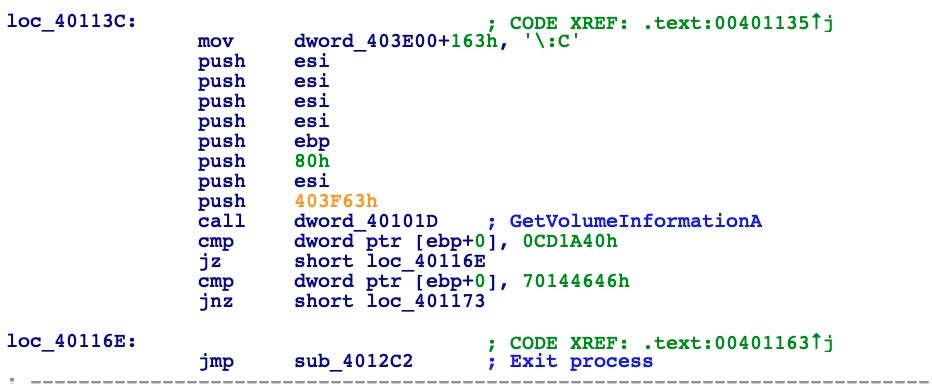
With this string saved somewhere in memory, the code goes on to perform some other checks trying to find any sign of running inside a virtual environment.
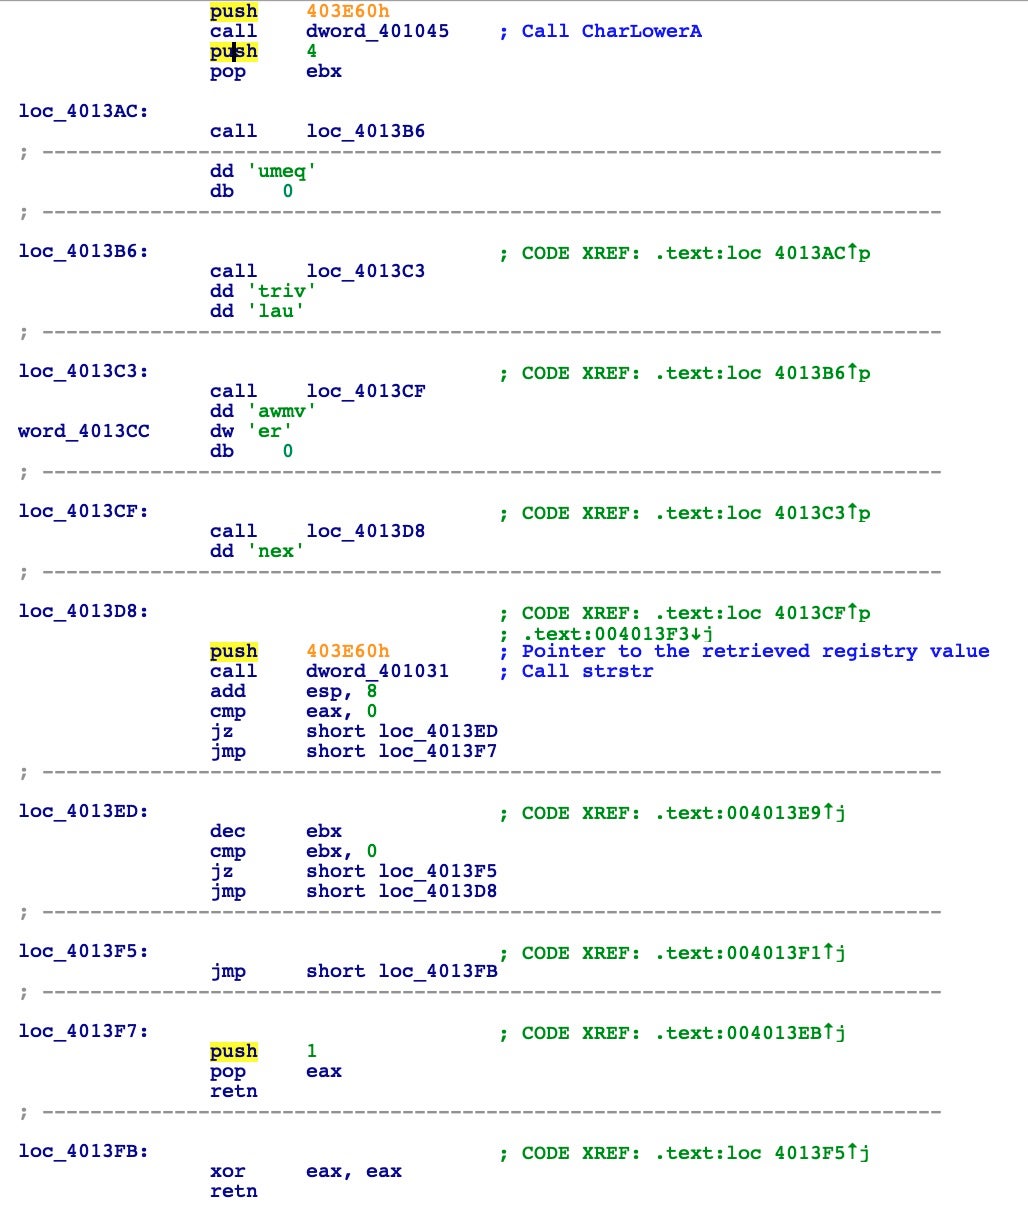
As part of the anti-virtual machine checks, it initializes a 4 cycle loop; during this loop it performs a call to the strstr function to search inside the retrieved registry value for any sign of the strings: “qemu”, “virtual”, “vmware”, “xen”. If you notice in the previous debugger screenshot, I’m running the sample inside a VMWare machine, so to continue I will need to patch the return value of strstr function calls to return zero.
Other checks are waiting:
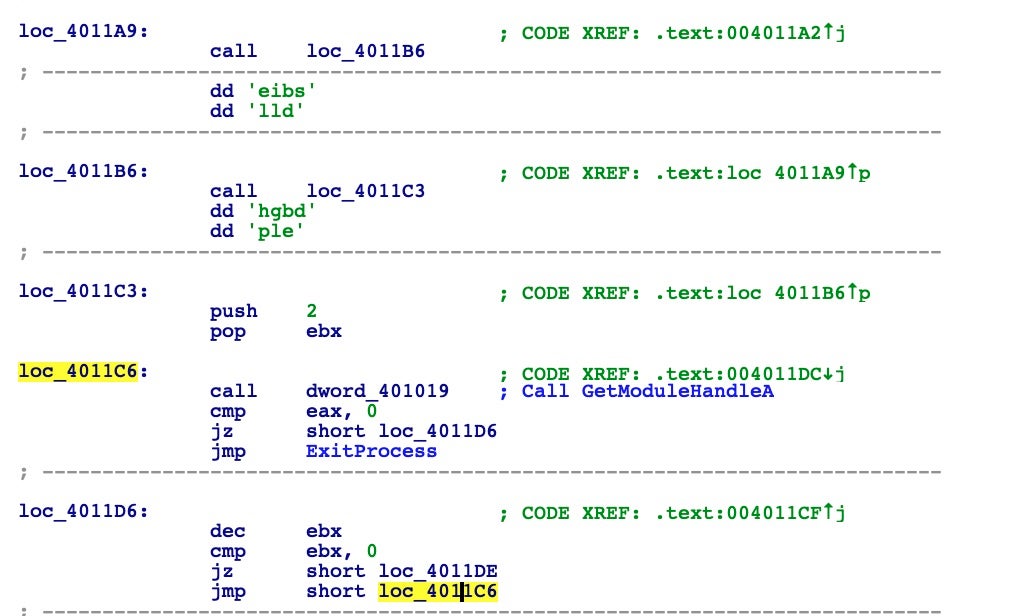
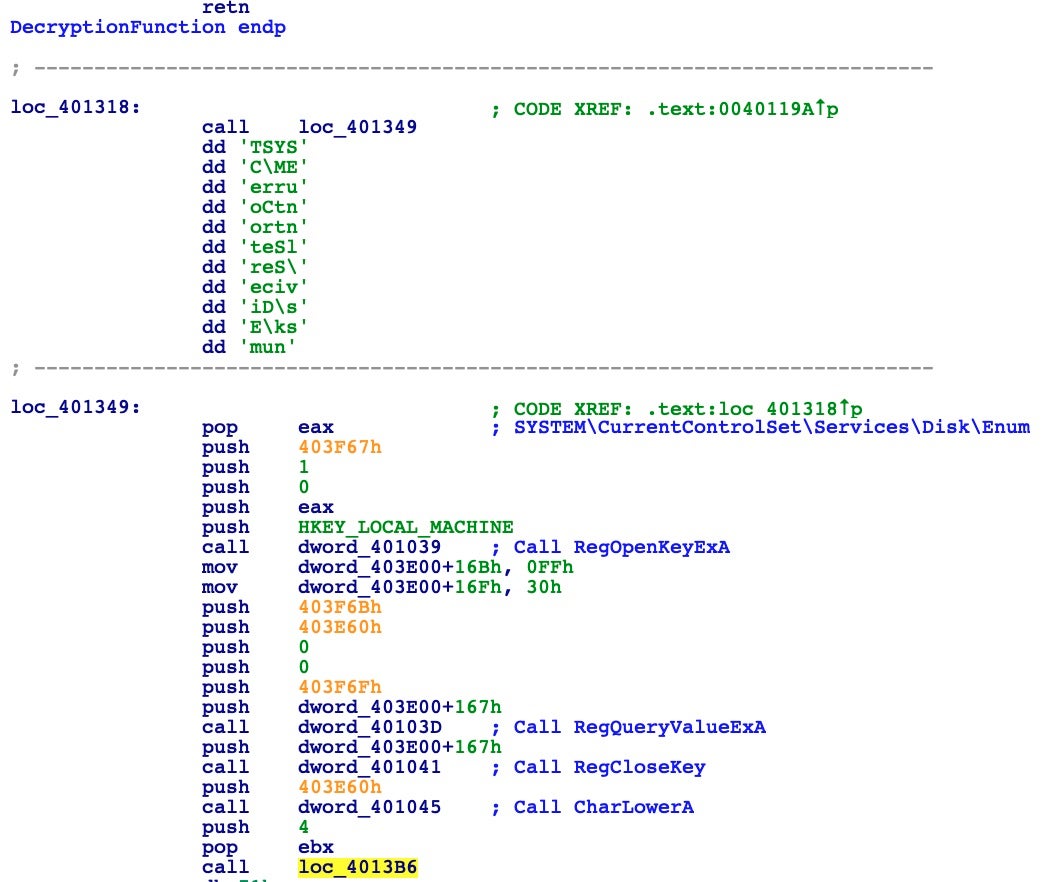
As you can see, the malware tries to understand if it’s being debugged or executed inside a sandbox by trying to get a handle to modules sbiedll and dbghelp. If it’s able to detect one of these two libraries, it terminates the process and exits.
Finally, The Payload!
Having passed all sorts of anti-analysis and anti-debugging checks, we finally reach the payload! Now, the malware begins to reveal its secrets in memory.
We can clearly see it’s a PE file, but it’s scrambled somehow. This code will be decoded and managed in memory with a complex routine.
Digging into this code will require more time and effort than the analyst will normally want to expend. Instead, we can detonate the malware in our isolated environment and observe its execution. As we will see in the next post, this will reveal that a new instance of svchost.exe is loaded into memory, which suggests some sort of process injection. If you enjoyed this deep dive and would like to know when the next Going Deep post is available, just subscribe to the SentinelOne blog newsletter!
IOCs
Sample Hash 07e81dfc0a01356fd96f5b75efe3d1b1bc86ade4

