AI Data Pipelines

Cleaner Data. Faster Detections. Lower Costs.

Security telemetry is growing at 35% annually, and the tools built to manage it were never designed for this volume. Singularity™ AI Data Pipelines transform raw telemetry into cleaner, AI-ready data for your SOC.

Neon dark analytics dashboard showing “Windows Event Logs [GOLD]” with tabs, tables, donut and line charts, filters

TODAY’S REALITY

01
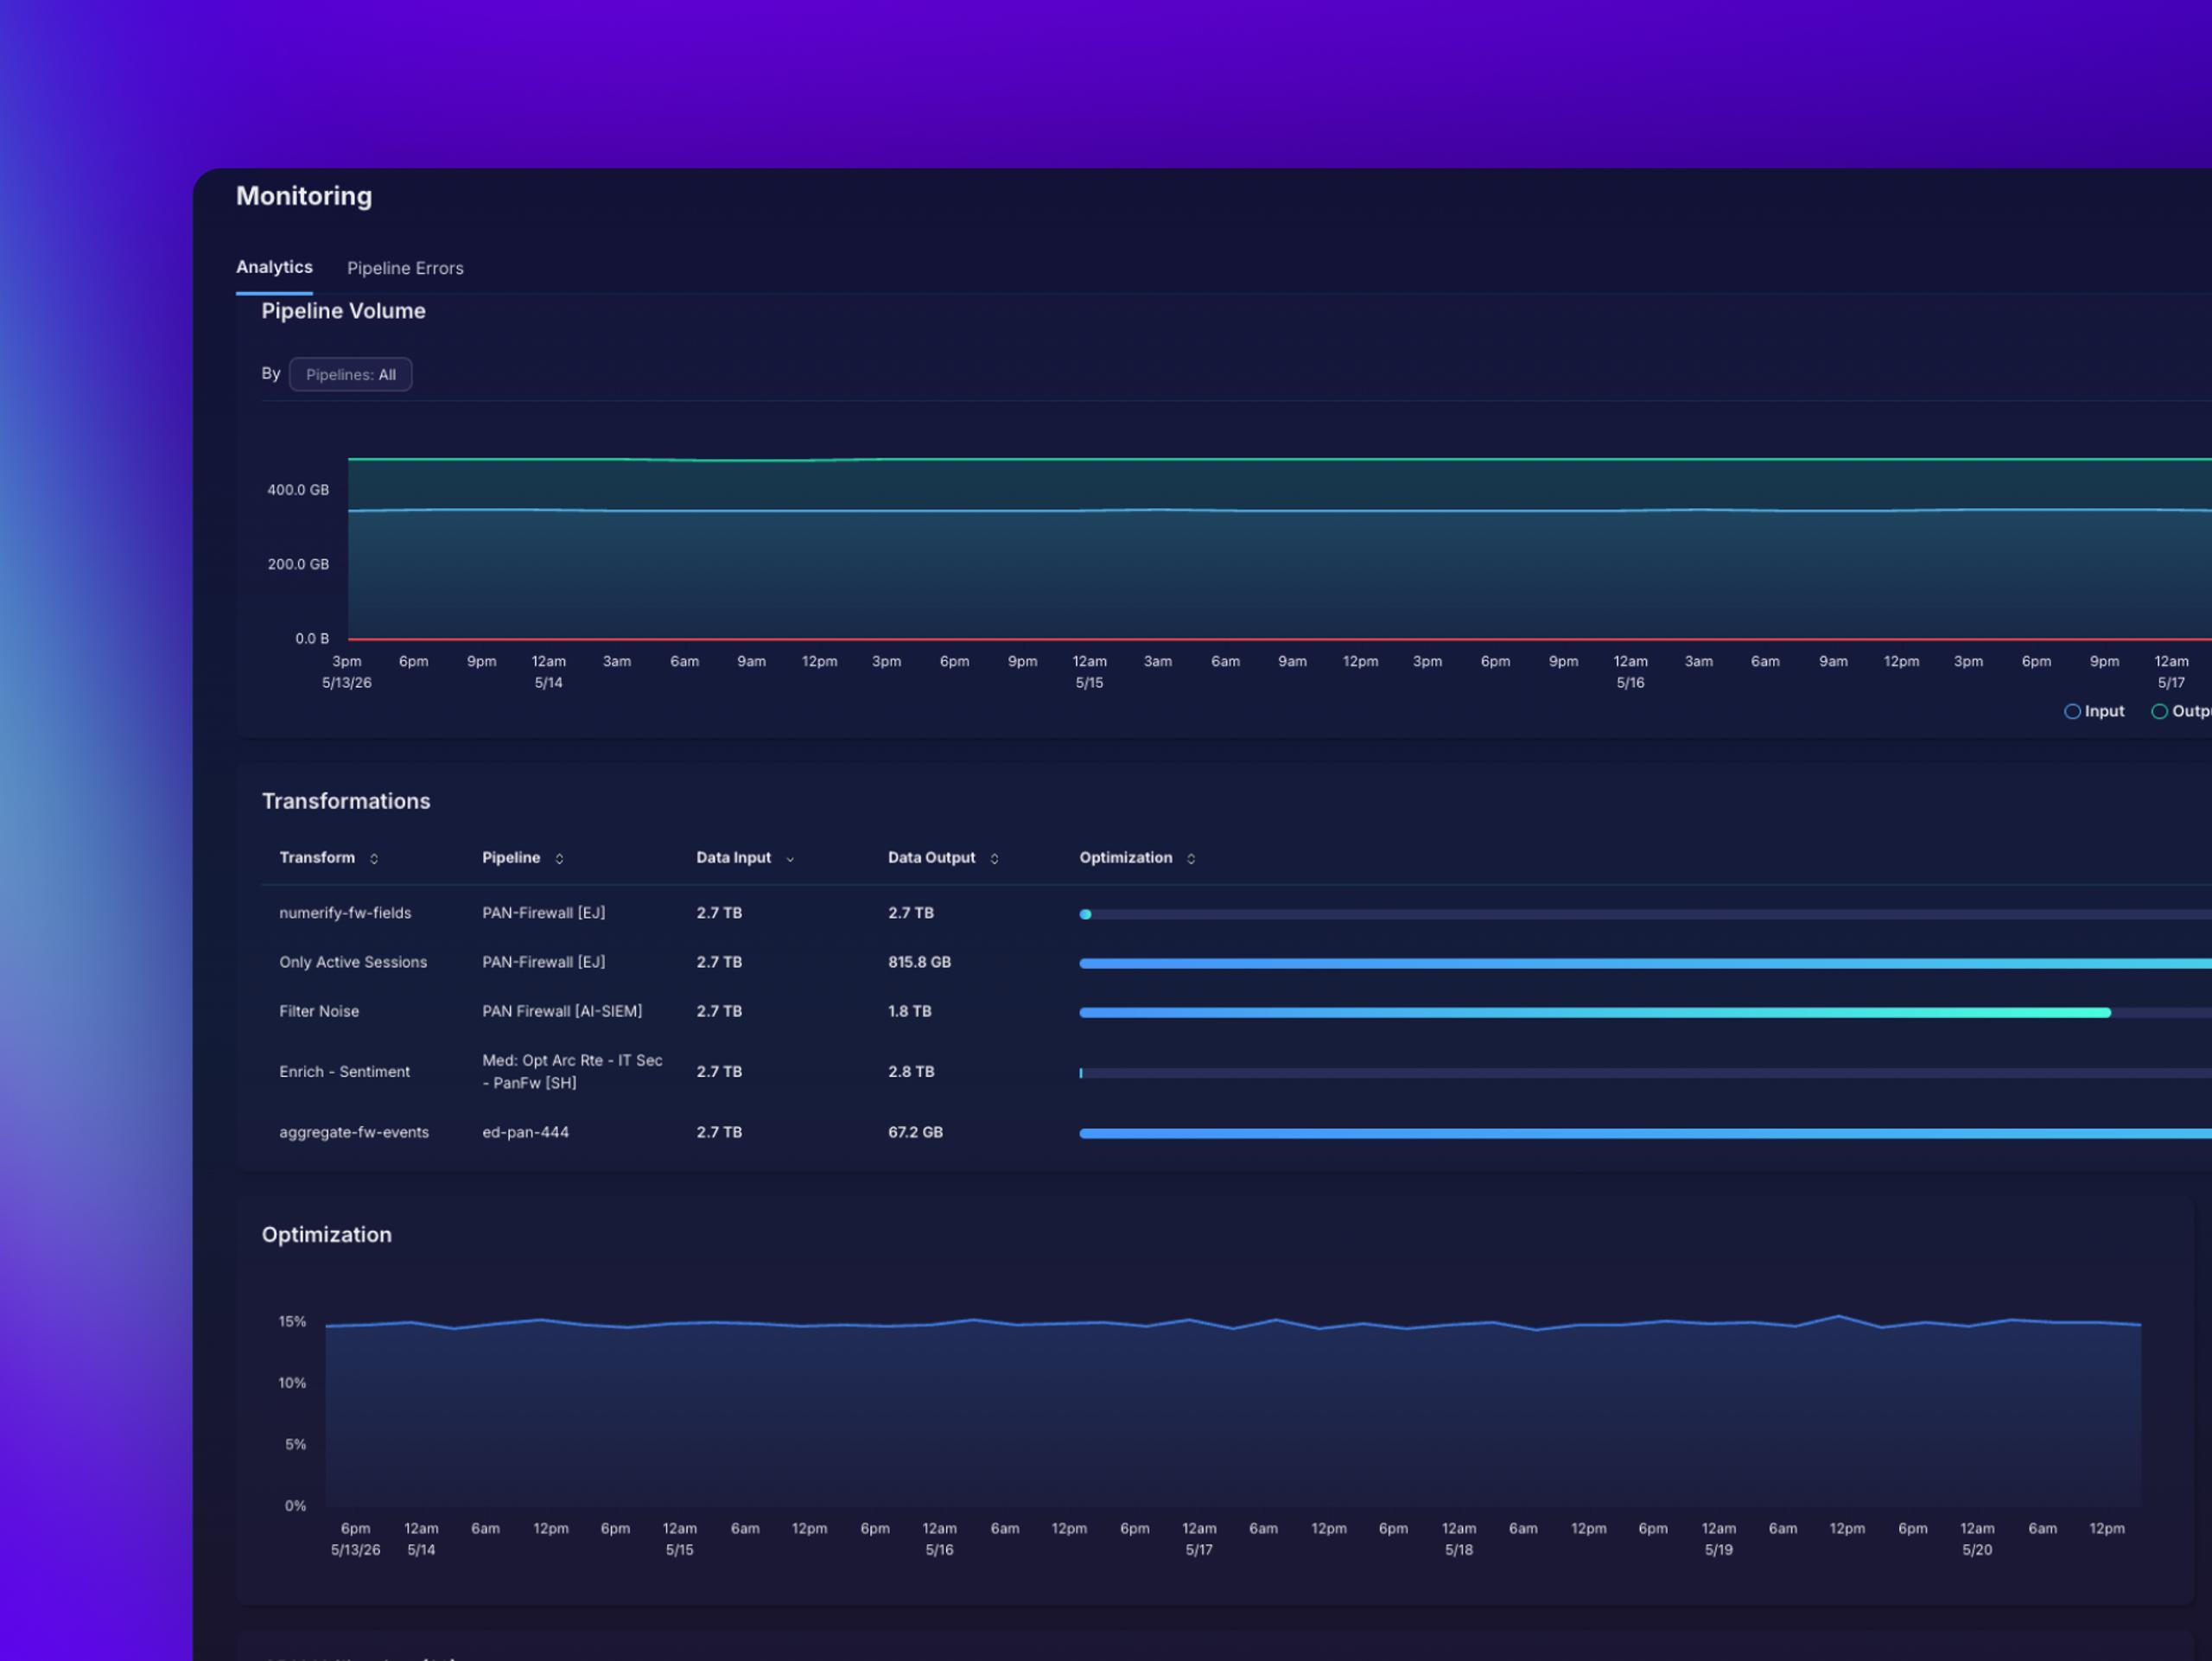
Dark analytics dashboard with headings Monitoring, Pipeline Volume and Optimization, plus Transformations table and blue progress bars

REDUCE DATA VOLUME

Cut the Noise Before It Hits the SIEM

AI identifies and filters low-value telemetry so your SIEM only ingests what matters.

  • Identify repetitive, low-value logs automatically

  • Reduce data volume by up to 80%

  • Preserve the signals that drive detections and investigations
02
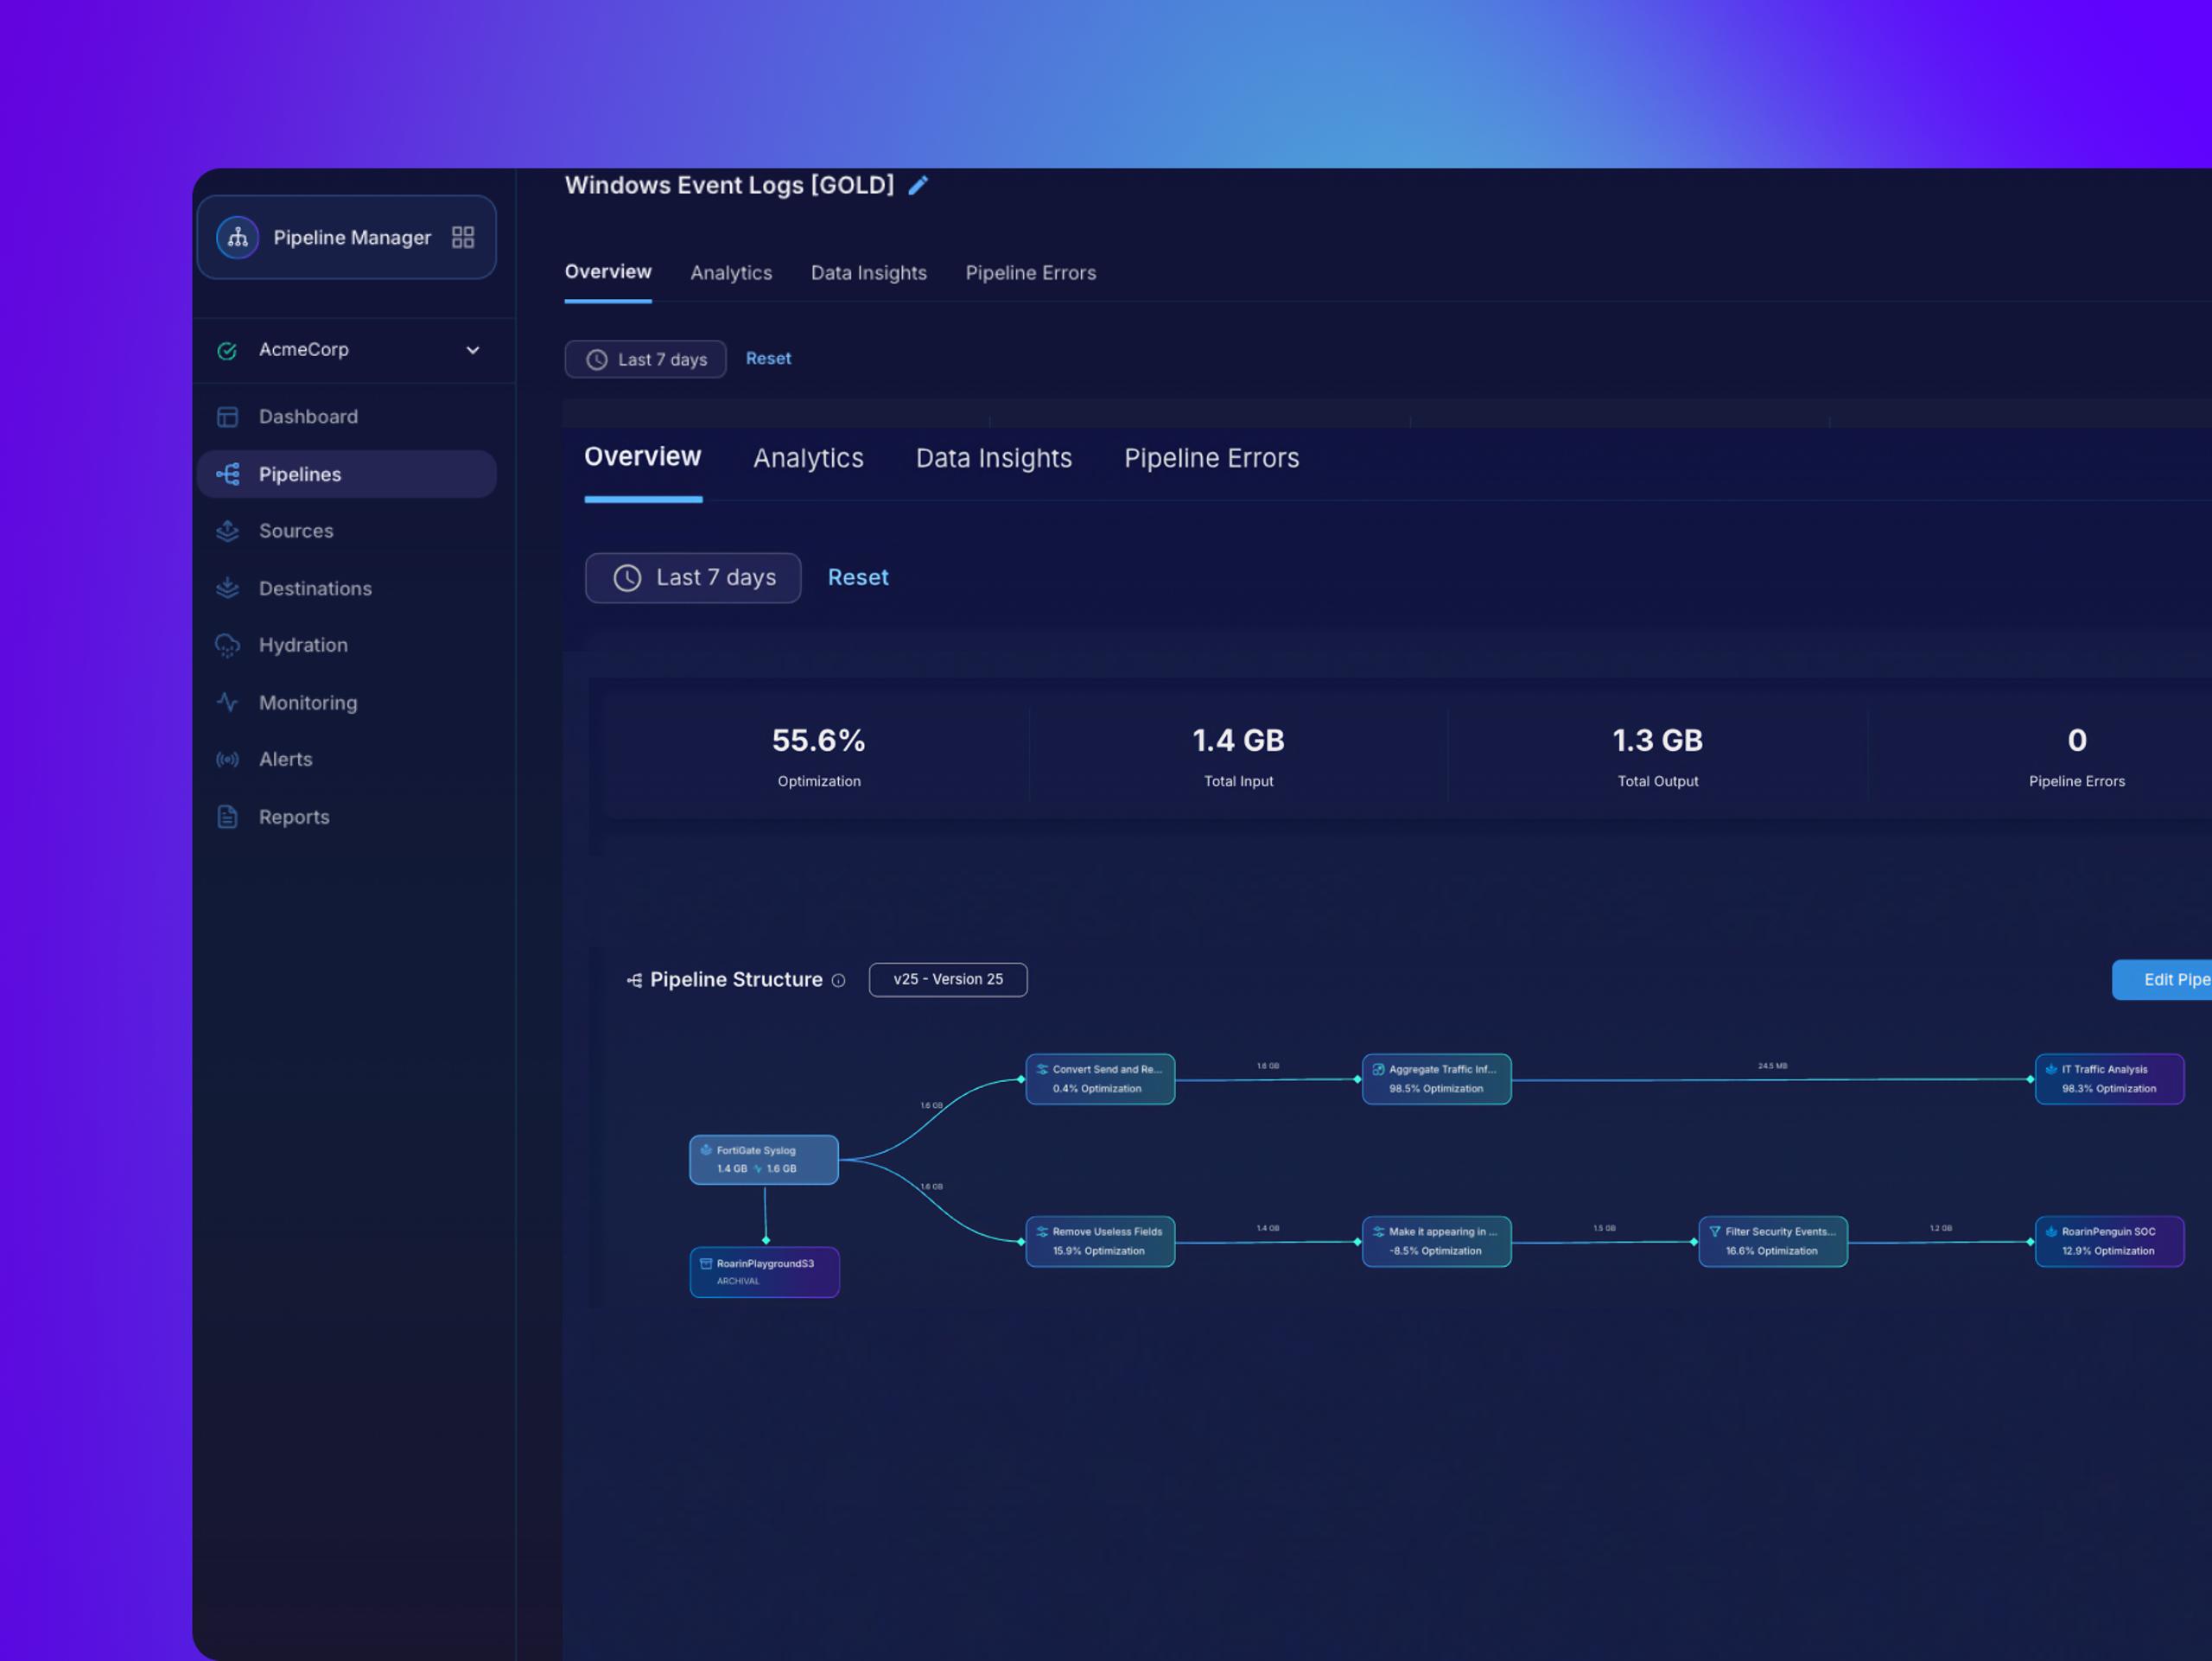
Dark analytics dashboard window with highlighted nav, title “Windows Event Logs (O&O)”, tabs incl. Overview, Last 7 days, metric cards (55.6%, 1.4 GB, 1.3 GB, 0), and pipeline flow diagram

SIMPLIFY SIEM MIGRATION

Migrate to AI SIEM Without Starting Over

Skip the pipeline rewrites and get high-value data flowing faster.

  • Work with existing collectors, no new infrastructure required

  • Minimize rework with AI-driven normalization

  • Accelerate time to value during migration

03
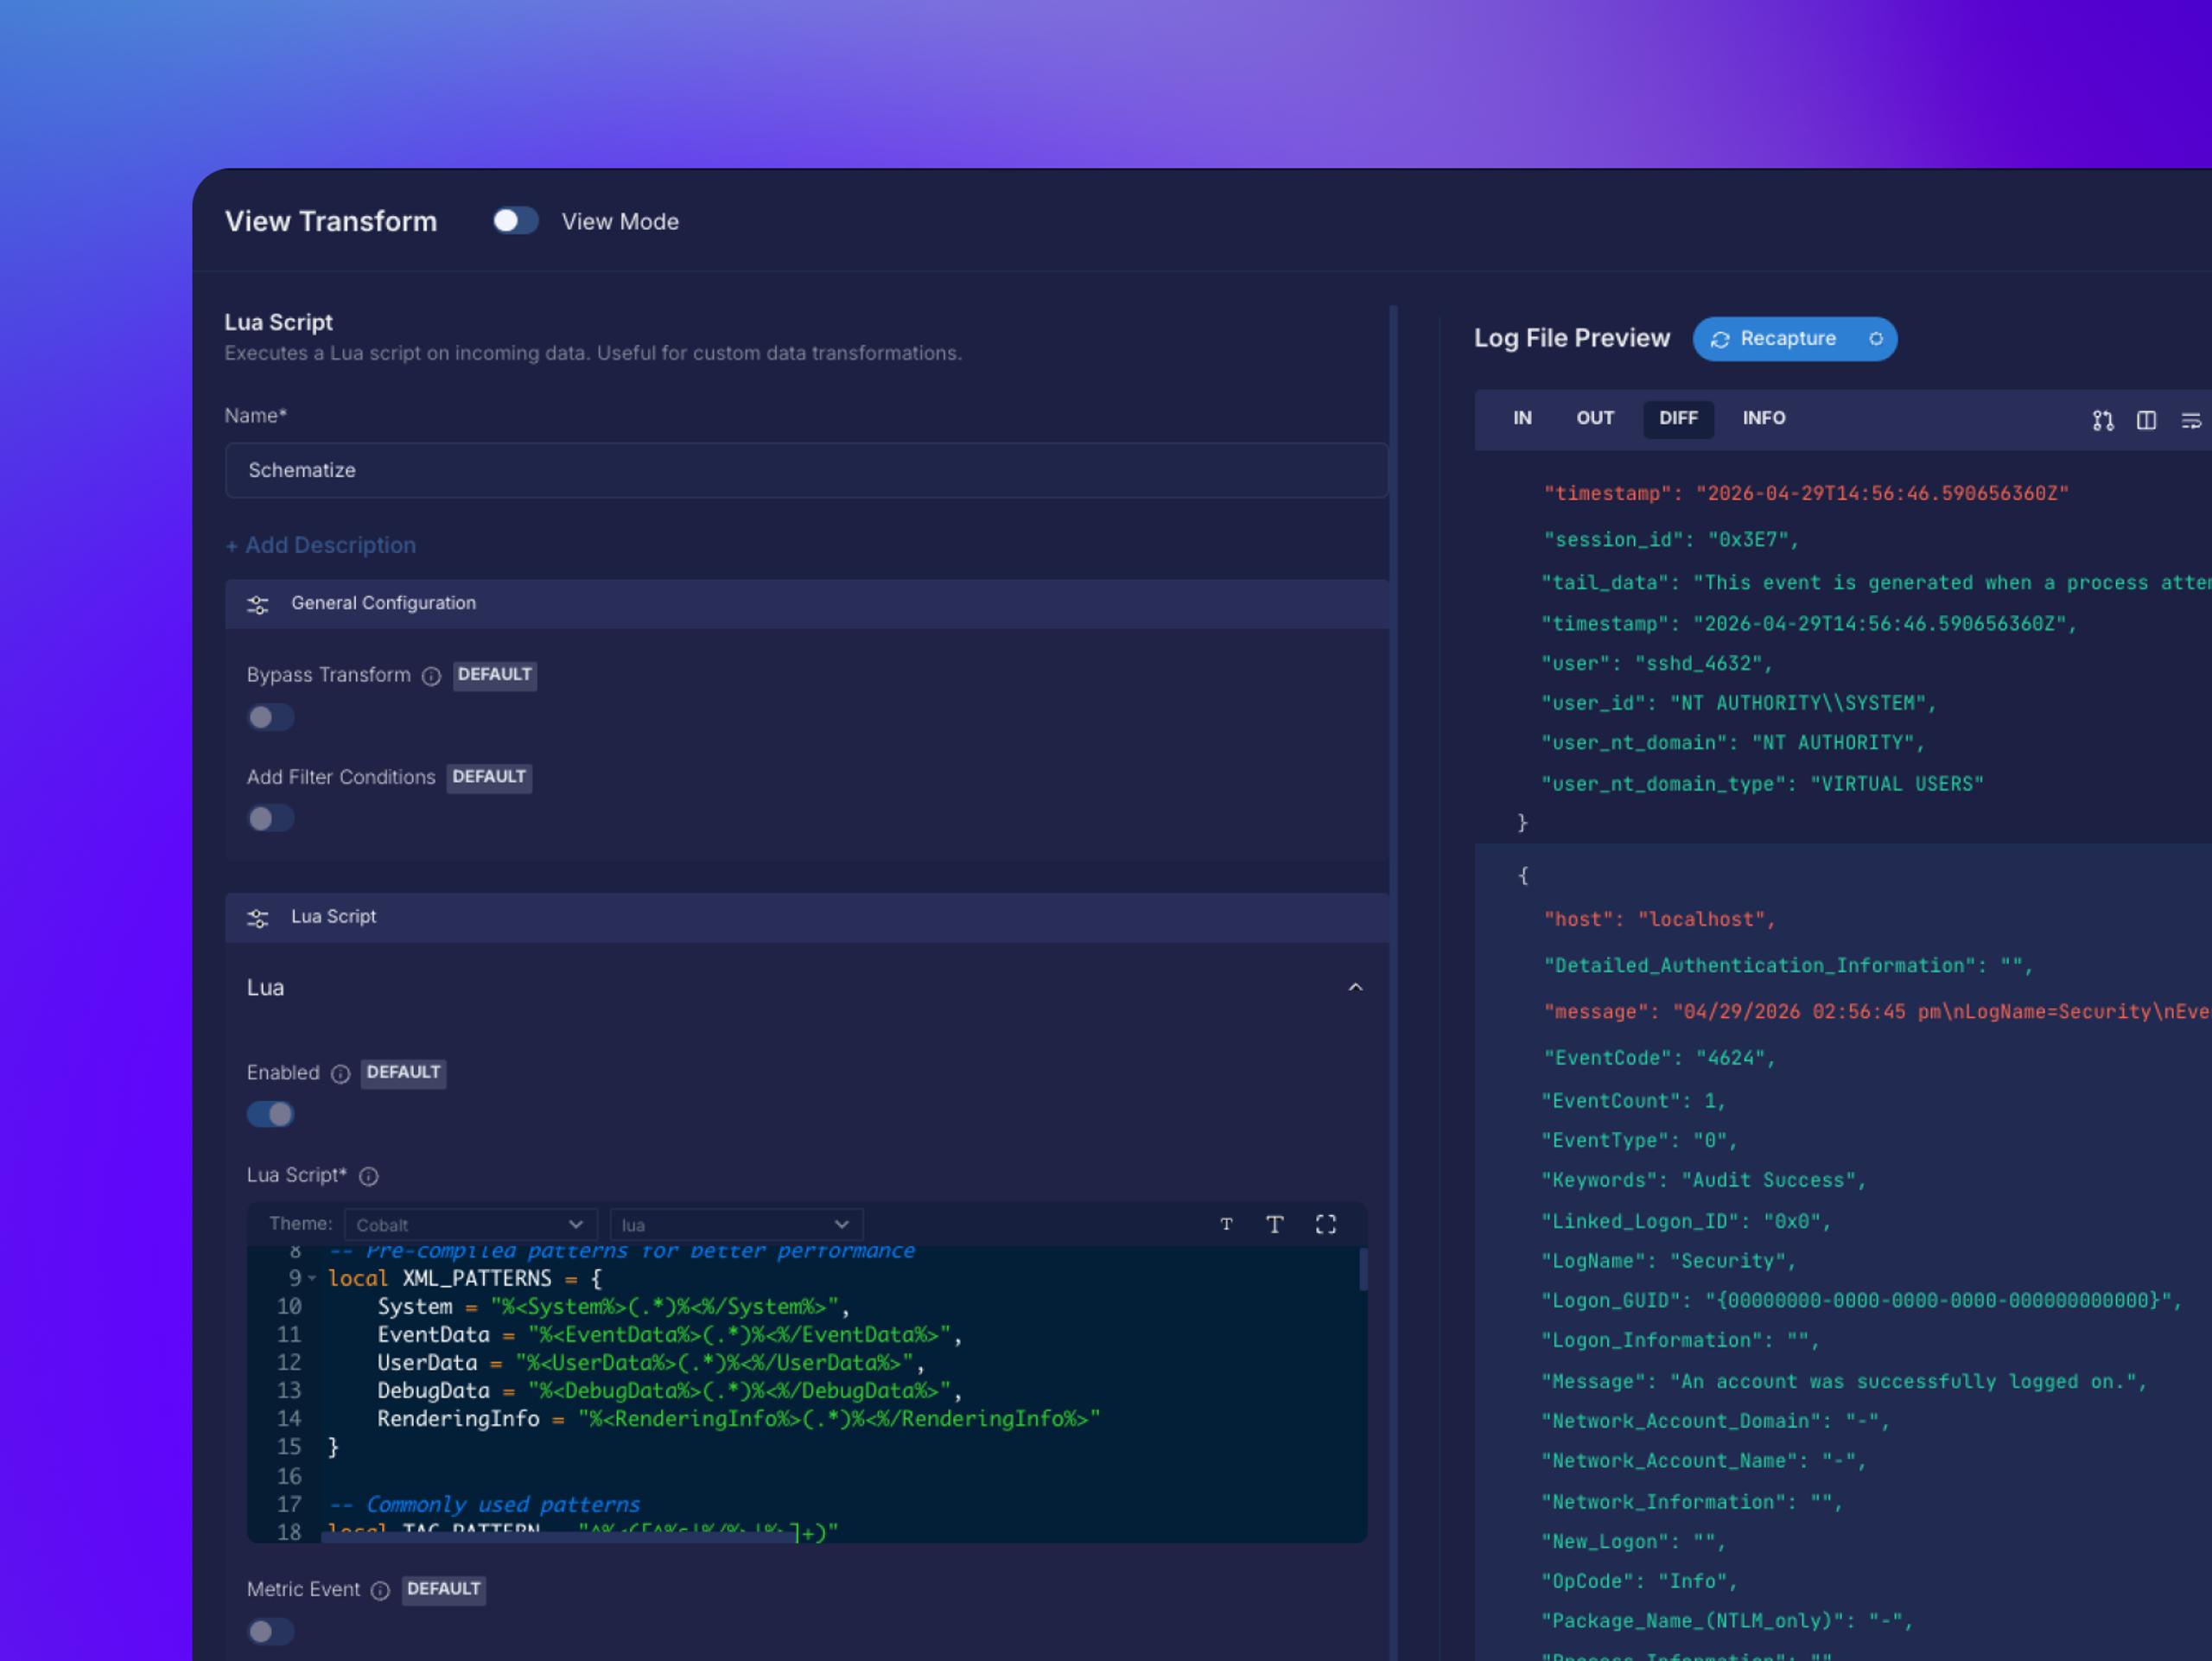
Dark software UI on gradient background: View Transform with View Mode and config sections plus code editor; Log File Preview with controls and colored log/JSON text

EXPAND VISIBILITY

Bring New Data Sources Online Faster

Normalize diverse telemetry into standardized, analysis-ready formats.

  • Out-of-the-box transforms and AI-driven Grok pattern generation

  • Apply OCSF and other industry-standard schemas at ingest

  • Structured, enriched data ready for analysis across the SOC

Decorative background gradient

GET STARTED

Glowing translucent light-blue 3D cube with symmetrical neon starburst prism bars on a white background, futuristic abstract

USE CASES

From Raw Data to Real Outcomes

Faster Investigations. Stronger Detections.

High-signal data means your SOC spends less time filtering and more time responding.

Abstract dark digital scene: faint wireframe hexagon with translucent blue-purple panels, glowing pink/green dots, and a white dotted perspective grid

Accelerate Mean Time to Detect

Reduce noise so detections fire on real threats, not false positives.

Learn More
Abstract 3D grid of translucent glasslike panels with metallic edges in purple/violet, with soft highlights and a small dark sphere

Speed Up Investigations

Enriched, normalized data gives analysts the context they need without the manual correlation.

Learn More
Blurred office scene: two people at a desk facing two monitors with code-like blue/white text; bright blinds glow behind

Improve Detection Accuracy

Higher-fidelity inputs produce higher-confidence alerts across your SIEM.

Learn More

RESULTS

The Data Speaks for Itself

Singularity AI Data Pipelines reduce noise, cut costs, and accelerate time to value across the SOC.
  1. 01

    0%

    Reduction in data volume before it reaches your SIEM

    Dark abstract 3D graphic with stacked purple translucent oval rings, central faint white line, lime marker arrow, yellow-green square grid, side tick dashes
  2. 02

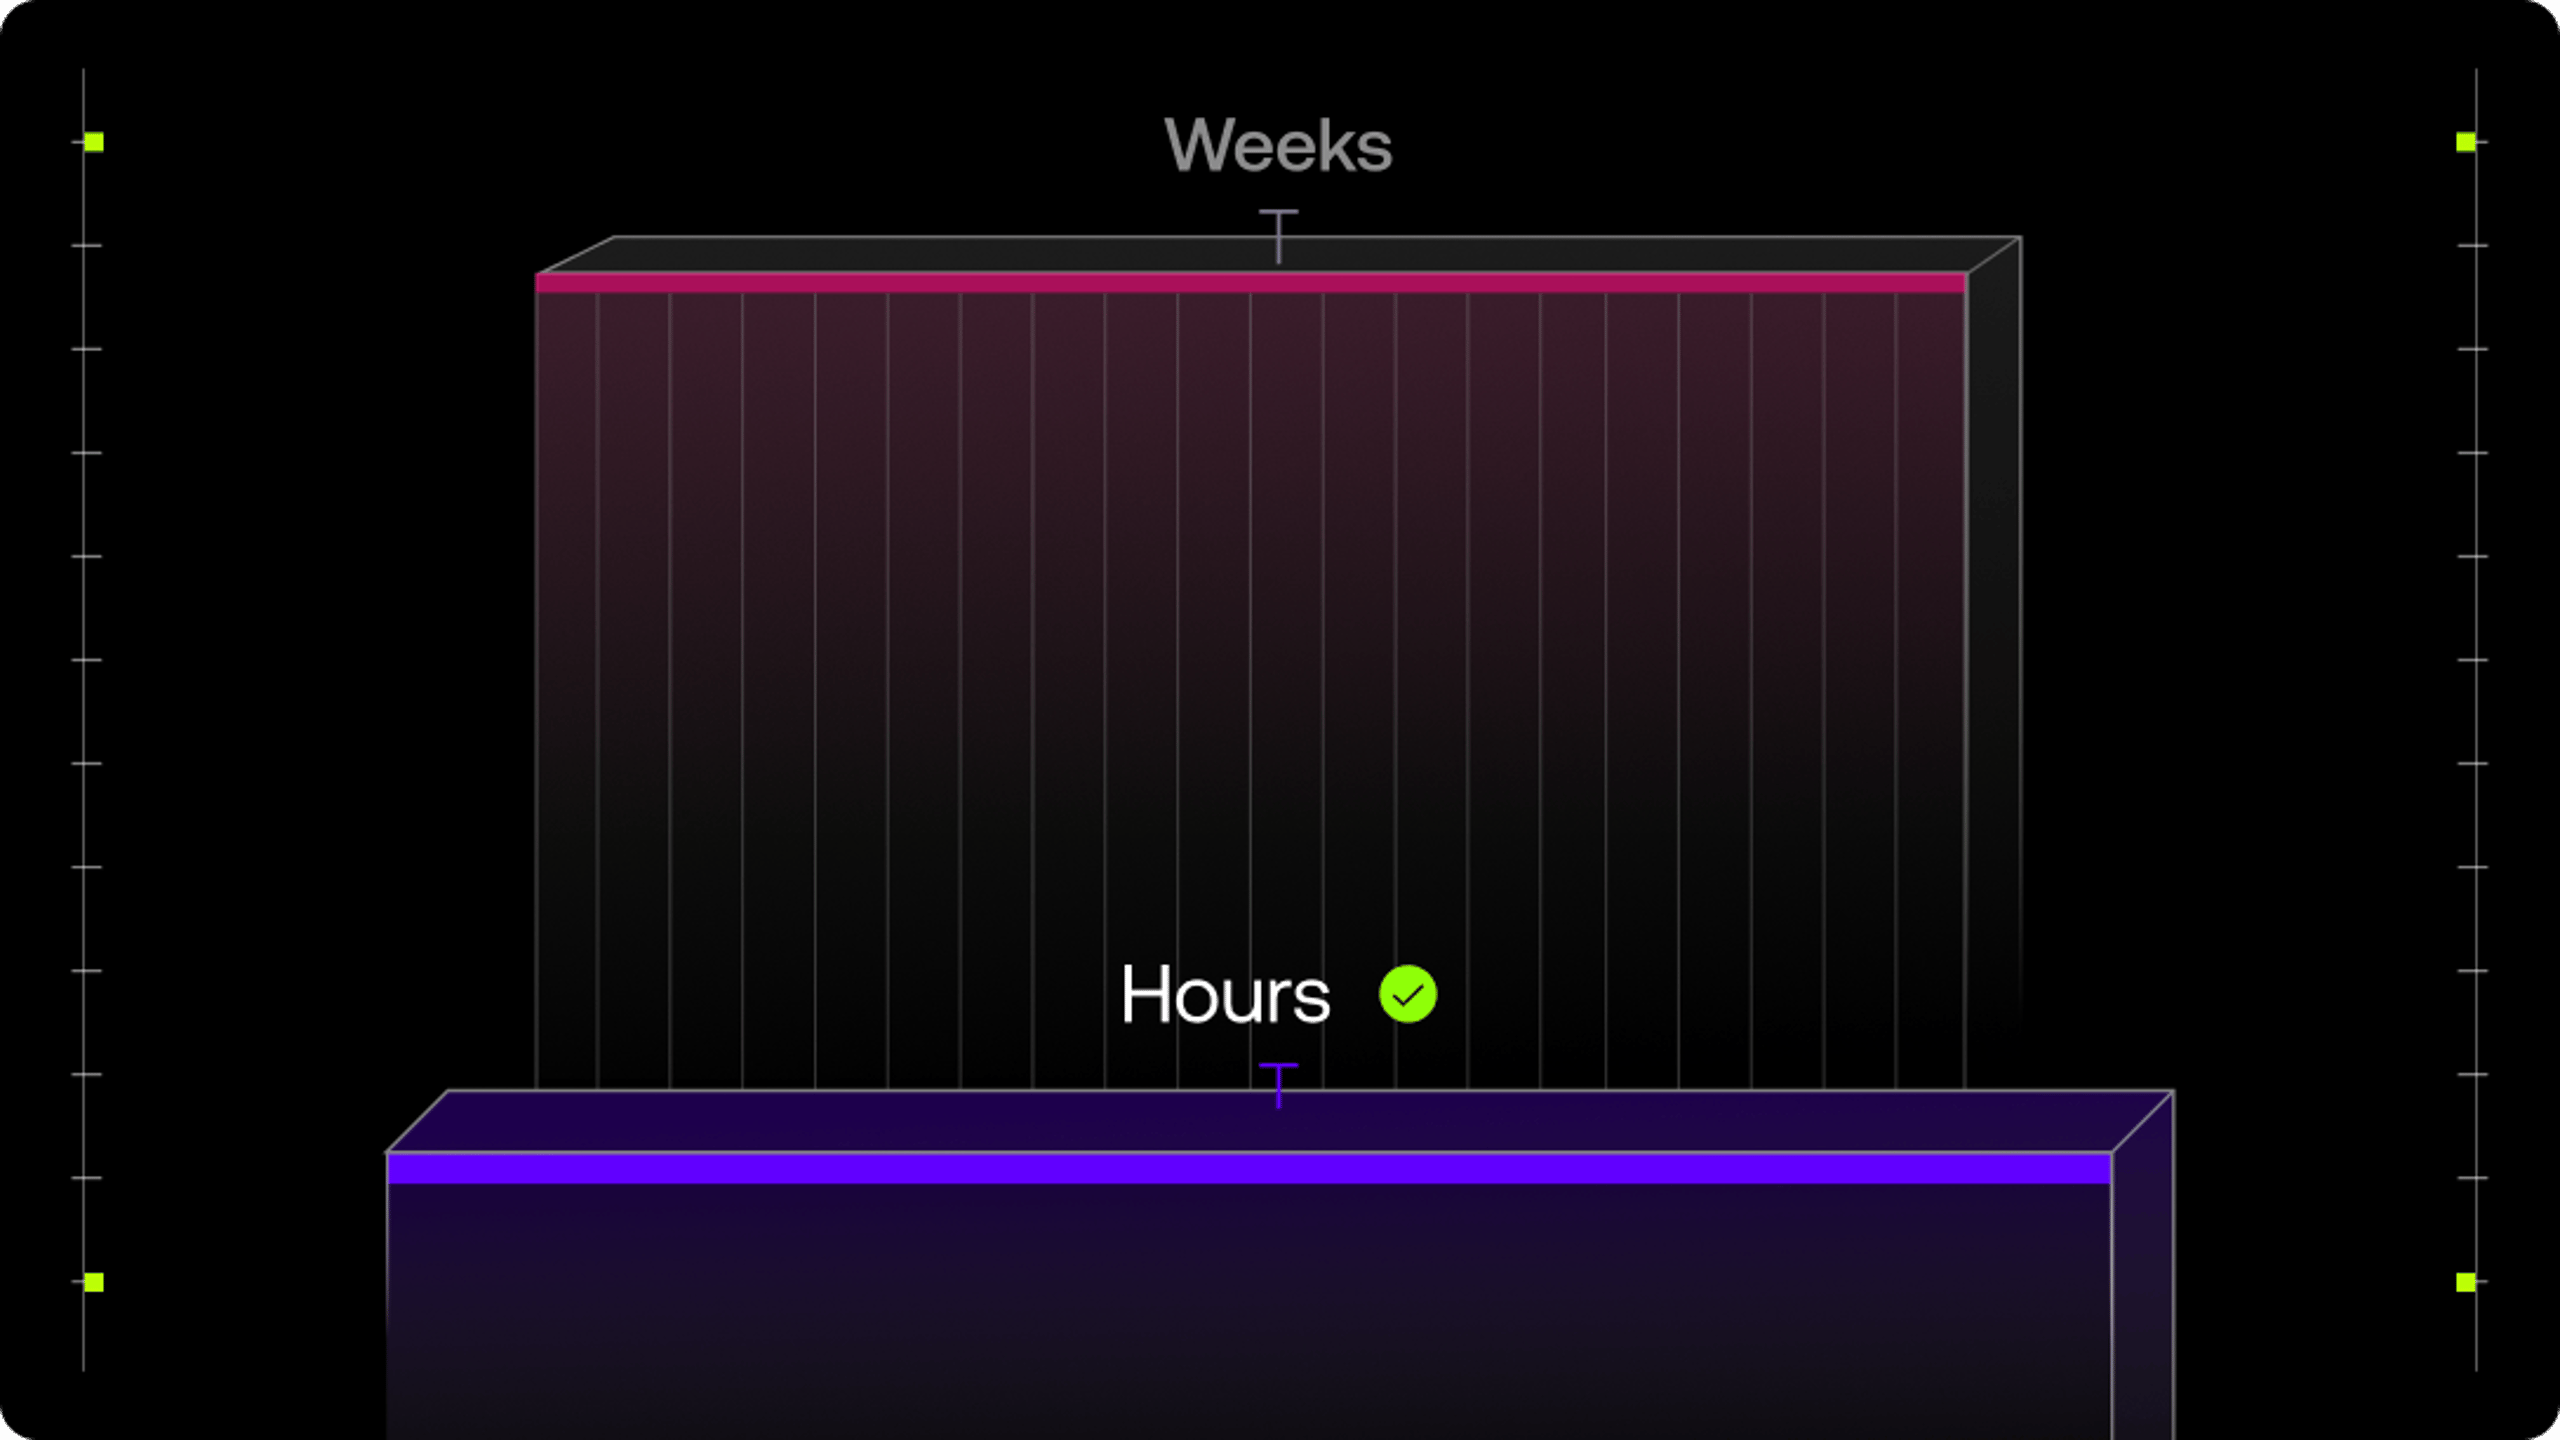
    Hours

    Hours, not weeks, to onboard new data sources with AI-driven normalization

    Minimal comparison infographic: stacked translucent 3D blocks labeled Weeks (magenta) and Hours (purple) with check mark, scale ticks on sides
  3. 03

    Zero

    Pipeline Rework. Migrate to AI SIEM without rebuilding collectors or pipelines

    Abstract dark background with layered diagonal semi-transparent purple rectangular panels and a yellow-green pixel tile grid

Why SentinelOne

The AI Data Pipeline Advantage

Other pipelines move data. Singularity AI Data Pipelines make it smarter, cleaner, and more valuable before it ever reaches your SIEM.
Blue-toned close-up of hands typing on a black keyboard with semi-transparent interface overlays for a digital work scene

AI-Native, Not Rules-Based

AI identifies low-value telemetry, continuously surfacing new optimization patterns as your data evolves.

Explore AI SIEM
Abstract dark graphic with a centered purple-blue glowing sphere and orbit-like light gray ellipses with purple dot nodes

Built into the Singularity Platform

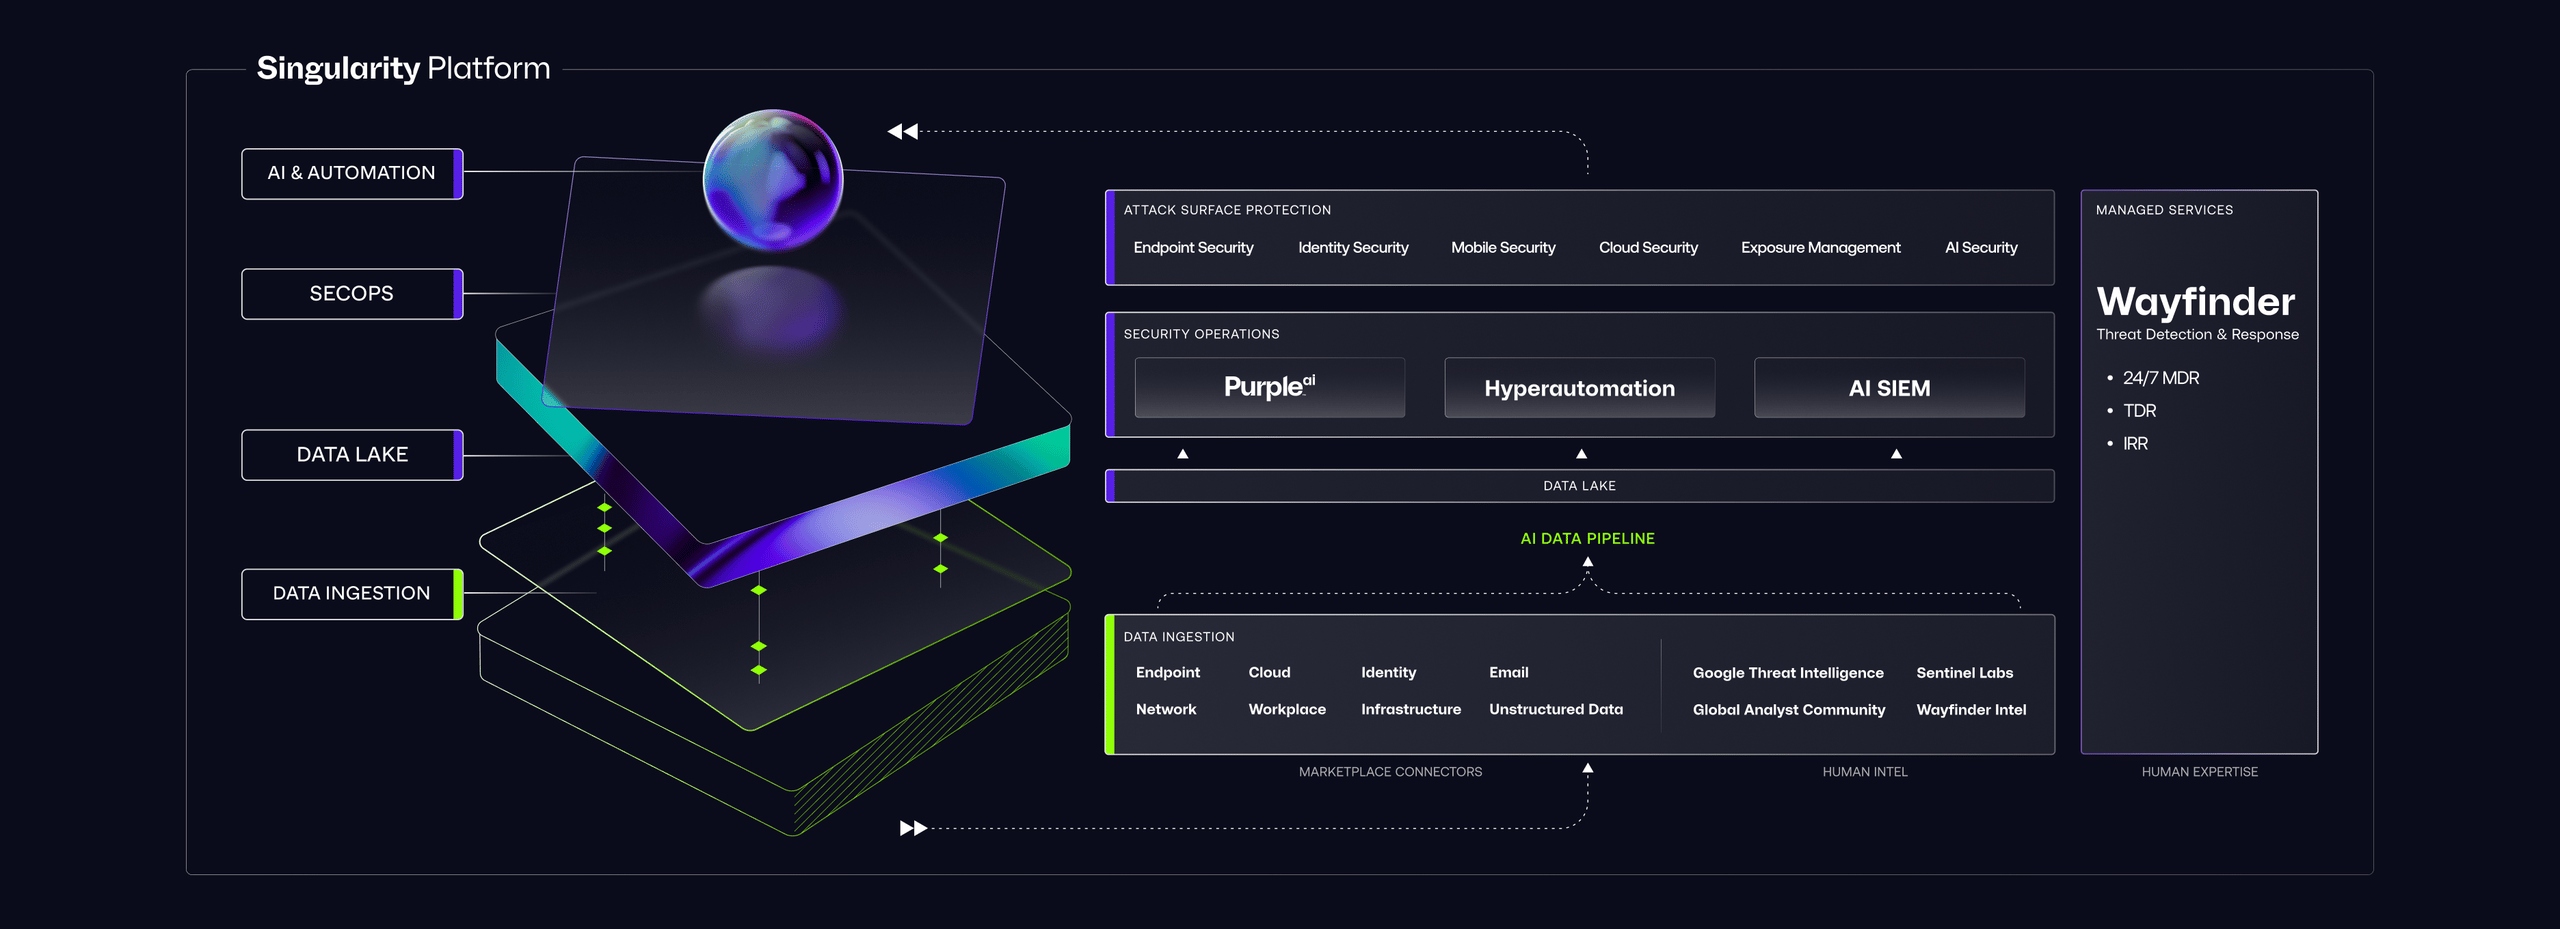
Built natively into the Singularity Platform, AI Data Pipelines share the same data foundation as AI SIEM, Data Lake, and Purple AI. One platform, consistently intelligent data across every capability.

Explore the Platform
Minimal abstract 3D geometric design: stacked glowing hexagons above nested purple-outlined platform shapes on dark navy background

OCSF and Open Standards

Data is normalized to OCSF and other industry schemas at ingest, ensuring consistency across every downstream detection and investigation.

Explore AI SIEM
Top-down aerial of a blue-lit highway interchange at dusk/night, with curved ramps, parked cars, traffic flow, and nearby buildings

From Ingest to Insight

Enrichment, filtering, and normalization happen in the pipeline, not after. Analysts see cleaner data from the first query.

Explore Purple AI

PLATFORM INTEGRATION

One Platform. Unified Data.

Futuristic UI mockup titled “Singularity Platform” with neon platform, orb, labeled sections, and sidebar “Wayfinder”

AI SIEM

High-signal, normalized data flows directly into AI SIEM for faster detections, richer investigations, and lower ingest costs.

Singularity Data Lake

Enriched telemetry feeds the Data Lake in standardized formats, ready for long-term retention, compliance, and historical analysis.

Purple AI

Cleaner data means sharpens Purple AI queries delivering faster, more accurate answers with every investigation.

GETTING STARTED

Up and Running in Days, Not Months.

Step 01

Connect and Normalize

Parse diverse telemetry formats and normalize into standardized schemas like OCSF. New data sources come online faster without manual schema development.

Step 02

Reduce and Optimize

AI-driven pattern detection identifies repetitive events and summarizes normal activity, reducing volume while preserving high-signal.

Step 03

Migrate with Confidence

Evaluate and transition to AI SIEM without redeploying collectors or rebuilding pipelines. Validate detections and move at your own pace.

Step 04

Monitor Pipeline Health

Real-time visibility into data flow, throughput, and ingestion gaps. Identify issues quickly and eliminate silent failures.

RESOURCES

Go Deeper on AI Data Pipelines

NEED ANSWERS?

Frequently Asked Questions

Singularity AI Data Pipelines are an AI-powered data optimization layer built into the SentinelOne Singularity Platform. They filter, normalize, and enrich security telemetry before it reaches your SIEM, reducing data volume by up to 80% while improving detection and investigation quality.

By using AI to identify and remove repetitive, low-value telemetry before ingestion, AI Data Pipelines significantly reduce the volume of data your SIEM processes and stores. Less data volume translates directly to lower ingest and storage costs.

Yes. AI Data Pipelines provide a migration path that works with your existing collectors, avoids pipeline rewrites, and normalizes data into standardized schemas. This accelerates the transition to AI SIEM without requiring your team to start from scratch.

AI Data Pipelines normalize telemetry into OCSF and other industry-standard schemas. AI-driven Grok pattern generation and out-of-the-box transforms support a wide range of data sources and formats.

AI Data Pipelines are built natively into the Singularity Platform. Filtered and enriched data flows directly into AI SIEM and Singularity Data Lake, and the cleaner inputs improve the accuracy of Purple AI queries and automated investigations.

Decorative background gradient

Next Steps

Get the Advantage of Cleaner Data

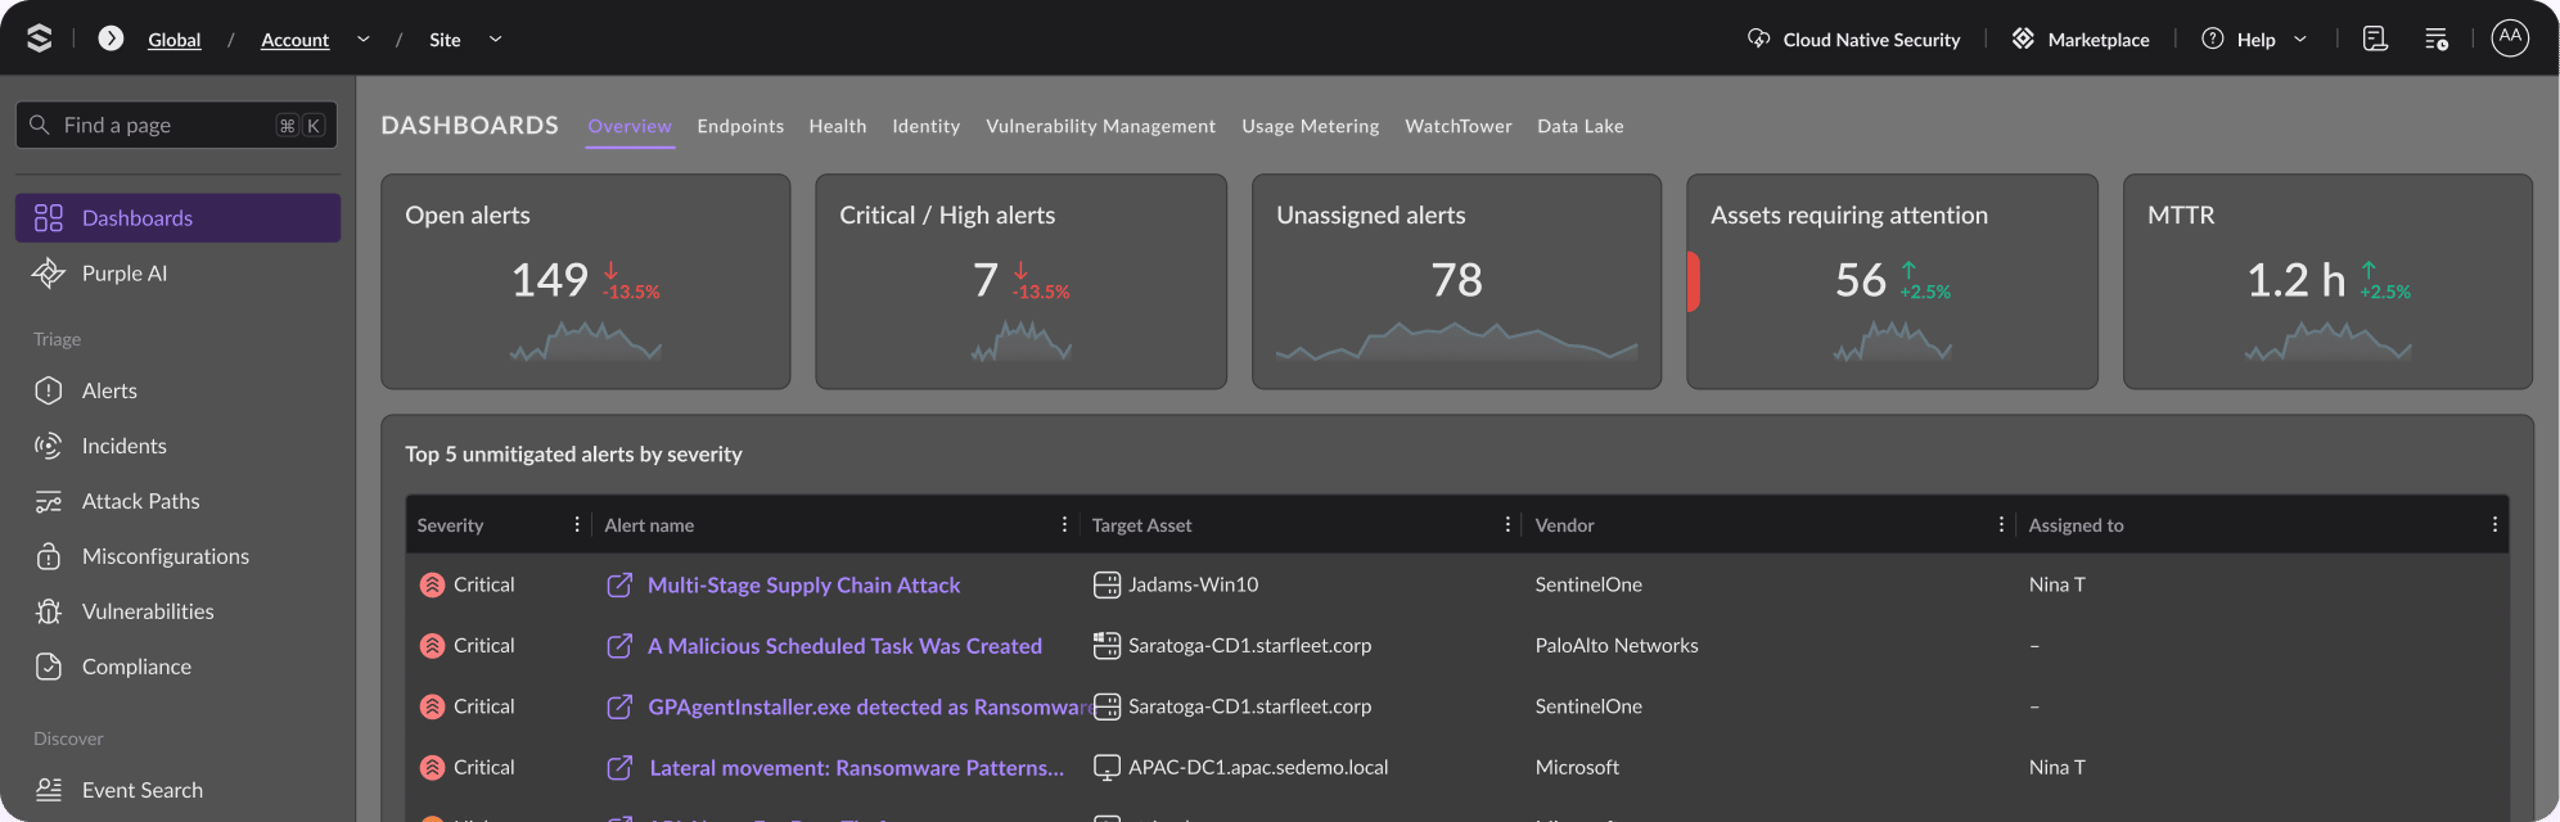
Dark dashboard UI with purple-highlighted nav, summary cards showing 149, 7, 78, 56, 1.2 h, and a status table with linked purple text