
In our previous foray into macOS malware reverse engineering, we guided those new to the field through the basics of static and dynamic analysis using nothing other than native tools such as strings, otool and lldb. In this new series of posts, we move into intermediate and more advanced techniques, introducing you to further tools and covering a wide range of real-world malware samples from commodity adware to trojans, backdoors, and spyware used by APT actors such as Lazarus and OceanLotus. We’ll walk through problems such as beating anti-analysis and sandbox checks, reversing encrypted strings, intercepting C2 comms and more.
We kick off with a walk-through on how to rapidly triage a new sample. Analysts are busy people, and the majority of malware samples you have to deal with are neither that interesting nor that complicated. We don’t want to get stuck in the weeds reversing lots of unnecessary code only to find out that the sample really wasn’t worth that much effort!
Ideally, we want to get a sample “triaged” in just a few minutes, where “triage” means that we understand the basics of the malware’s behavior and objectives, collecting just enough data to be able to effectively hunt for related samples and detect them in our environments. For those rarer samples that pique our interest and look like they need deeper analysis, we want our triage session to give an overall profile of the sample and indicate areas for further investigation.
Why Use radare2 (r2) for macOS Malware Analysis?
For rapid triage, my preferred tool is radare2 (aka r2). There are many introductory blogs on installing and using r2, and I’m not going to cover that material here. Such posts will serve you well in terms of learning your way around the basics of installing and using the tool if it’s completely new to you.
However, most such posts are aimed at CTF/crackme readers and typically showcase simple ELF or PE binaries. Very few are aimed at malware analysts, and even fewer still are aimed at macOS malware analysts, so they are not much use to us from a practical point of view. I’m going to assume that you’ve read at least one or two basic intro r2 posts before starting on the material below. For a rare example of r2 introductory material using Mach-O samples (albeit not malware), I recommend having a look at these two helpful posts: 1, 2.
Before we dive in, I do want to say a little bit about why r2 is a good choice for macOS malware analysis, as I expect at least some readers are likely already familiar with other tools such as IDA, Ghidra and perhaps even Hopper, and may be asking that question from the outset.
Radare2 is an extremely powerful and customizable reversing platform, and – at least the way I use it – a great deal of that power comes from the very feature that puts some people off: it’s a command line tool rather than a GUI tool.
Because of that, r2 is very fast, lightweight, and stable. You can install and run it very quickly in a new VM without having to worry about dependencies or licensing (the latter, because it’s free) and it’s much less likely (in my experience) to crash on you or corrupt a file or refuse to start. And as we’ll see in the tips below, you can triage a binary with it very quickly indeed!
Moreover, because it’s a command line tool, it integrates very easily with other command line tools that you are likely familiar with, including things like grep, awk, diff and so on. Other tools typically require you to develop separate scripts in python or Java to do various tailored tasks, but with r2 you can often accomplish the same just by piping output through familiar command line tools (we’ll be looking at some examples of doing that below).
Finally, because r2 is free, multi-platform and runs on pretty much anything at all that can run a terminal emulator, learning how to reverse with r2 is a transferable skill you can take advantage of anywhere.
Enough of the hard sell, let’s get down to triaging some malware! For this post, we’re going to look at a malware sample called OSX.Calisto. Be sure to set up an isolated VM, download the sample from here (password:infect3d) and install r2.
Then, let’s get started!
1. Fun with Functions, Calls, XREFS and More
Our sample, OSX.Calisto, is a backdoor that tries to exfiltrate the user’s keychain, username and clear text copy of the login password. The first tip about using r2 quickly is to load your sample with the -AA option, like so:
% r2 -AA calisto
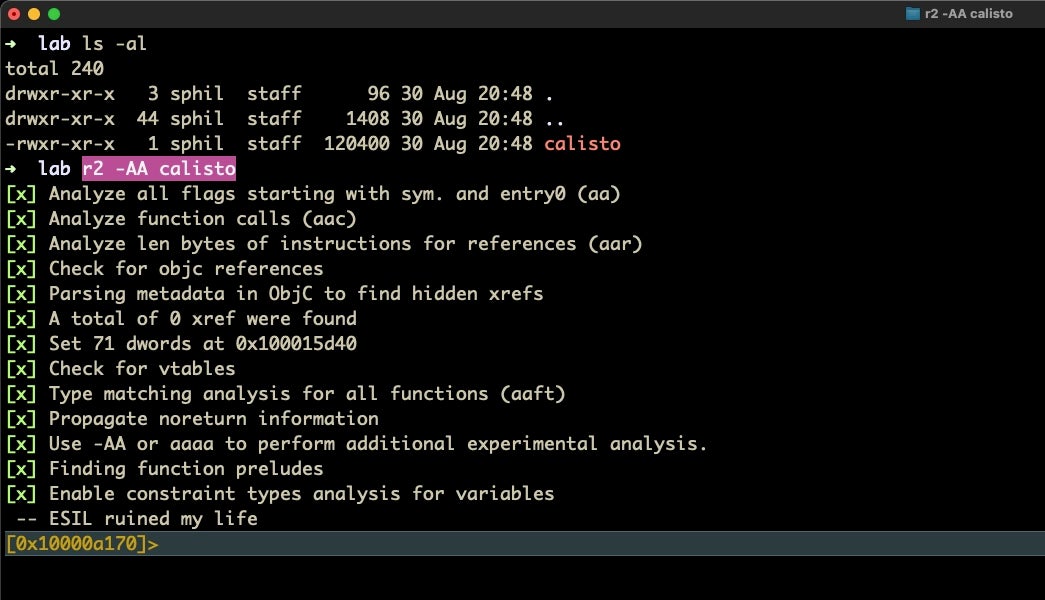
This performs the same analysis as loading the file and then running aaa from within r2. It’s not only faster to do it in one step, it also cuts out the possibility of forgetting to run the analysis command after loading the binary.
Now that our Calisto sample is loaded and analysed, the first thing that we should do is list all the functions in verbose mode with afll. What is particularly useful about this command is that it gives a great overview of the malware. Not only can we see all the function calls, we can see which are imports, which are dead code, which are making the most system calls, which take the most (or least) arguments, how many variables each declares and more. From here, we are in a very good position to see both what the malware does and where it does it.
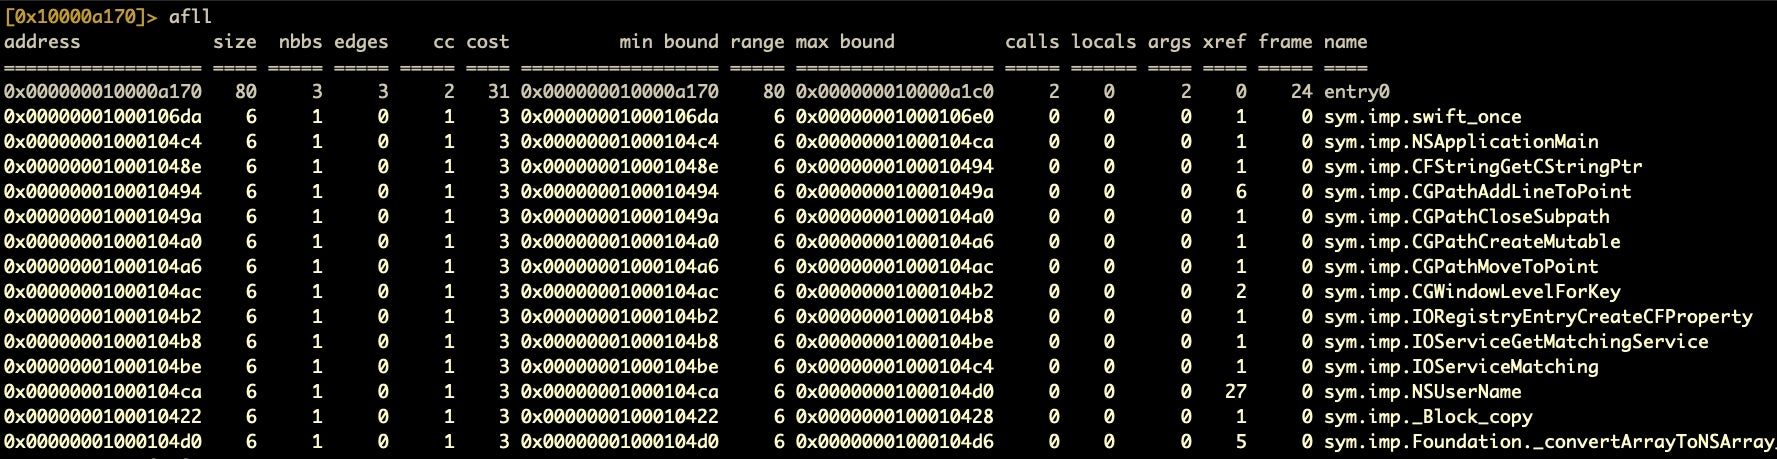
Even from just the top of that list, we can see that this malware makes a lot of calls to NSUserName. Typically, though, we will want to sort that table. Although r2 has an internal function for sorting the function table (aflt), I have not found the output to be reliable.
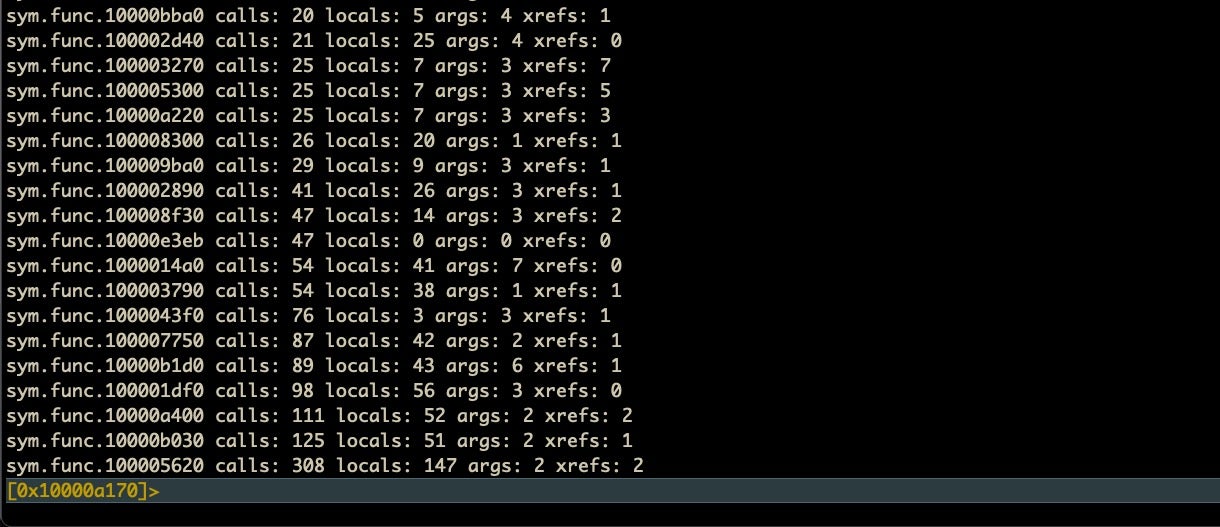
Fortunately, there is another way, which will introduce us to a more general “power feature” of r2. This is to pipe the output of afll through awk and sort. Say, for example, we would like to sort only select columns (we don’t want all that noisy data!):
afll | awk '{print $15 " calls: " $10" locals: "$11" args: "$12" xrefs: "$13}' | sort -k 3 -n
Here we pipe the output through awk, selecting only the columns we want and then pipe and sort on the third column (number of calls). We add the -n option to make the sort numerical. We can reverse the sort with -r.
Note that we never left r2 throughout this whole process, making the whole thing extremely convenient. If we wanted to do the same and output the results to file, just do that as you would normally on the command line with a > <path_to_file>.
2. Quickly Dive Into a Function’s Calls
Having found something of interest, we will naturally want to take a quick look at it to see if our hunch is right. We can do that rapidly in a couple of ways as the next few tips will show.
Normally, from that function table, it would make sense to look for functions that have a particular profile such as lots of calls, args, and/or xrefs, and then look at those particular functions in more detail.
Back in our Calisto example, we noted there was one function that had a lot of calls: sym.func.100005620, but we don’t necessarily want to spend time looking at that function if those calls aren’t doing anything interesting.
We can get a look at what calls a function makes very quickly just by typing in a variant of the afll command, aflm. You might want to just punch that in and see what it outputs.
aflm
Yeah, useful, but overwhelming! As we noted in the previous section, we can easily filter things with command line tools while still in r2, so we could pipe that output to grep. But how many lines should we grep after the pattern? For example, if you try
aflm | grep -A 100 5620:
You’ll shoot way over target, because although there may be more calls in that function, aflm only lists each unique call. A better way is to pipe through sed and tell sed to stop piping when it hits another colon (signalling another function listing).
aflm | sed -n ‘/5620:/,/:/p’
The above command says “search for the pattern “/5620:/”, keep going (“/,/”) until you find the next “/:/”. The final “/p” tells sed to print all that it found.
You’ll get an output like this:
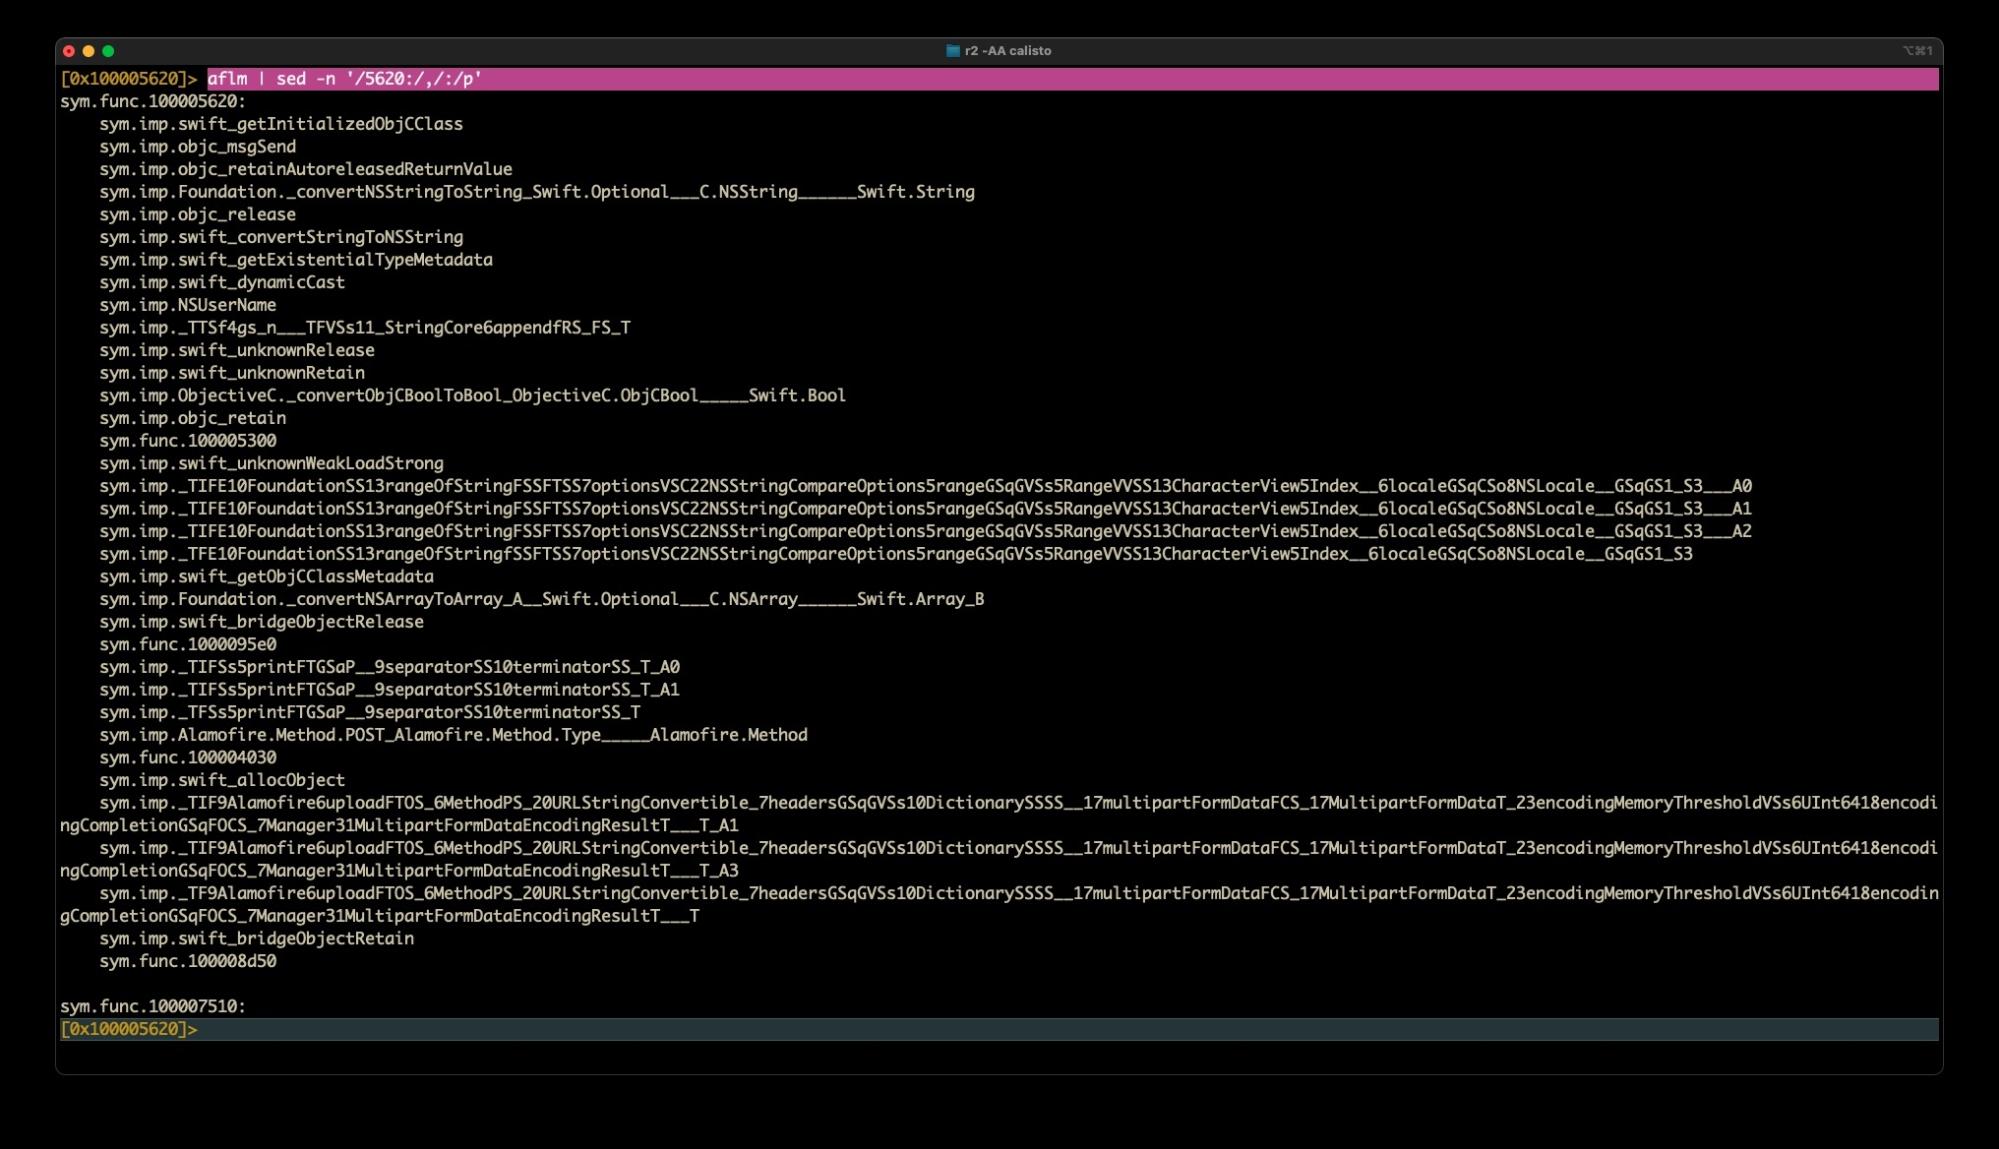
Awesome! Now we can see all the calls that this huge function makes. From that alone we can infer that this function appears to grab the User name, does some string searching, possibly builds an array out of what it finds, and then uploads some data to a remote server! And we haven’t even done any disassembly yet!
3. Strings on Steroids
At this point, we might want to go back to the function table and repeat the above steps on a few different functions, but we also have another option. Having seen that NSUserName is called on multiple occasions, we might want to look more closely at how the malware is interacting with the user. As we explained in our previous guide on reversing macOS malware, extracting strings from a binary can give you a very good insight into what the malware is up to, so much so that some malware authors take great efforts to obfuscate and encrypt the binary’s strings (something we’ll be looking at in a later post). Fortunately, the author of Calisto wasn’t one of those. Let’s see how we can use r2 to help us with string analysis.
The main command for dumping strings is
izz
However, that dump isn’t pretty and doesn’t make for easy analysis. Fortunately, there’s a much nicer way to look at and filter strings in radare2. Let’s try this instead:
izz~...
The tilde is r2’s internal “grep” command, but more importantly the three periods pipe the string dump into a “HUD” (Heads Up Display) from where we can type filter characters. For example, after issuing the above command, type a single “/” to reveal all strings (like paths and URLs, for example) containing a forward slash. Backspace to clear that and try other filters in turn like “http” and “user”. As the images below show, we quickly hit pay dirt!
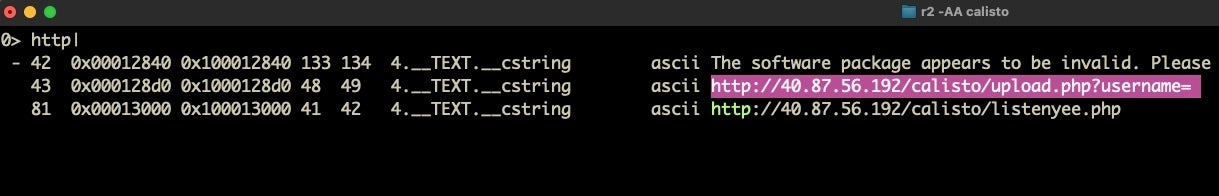
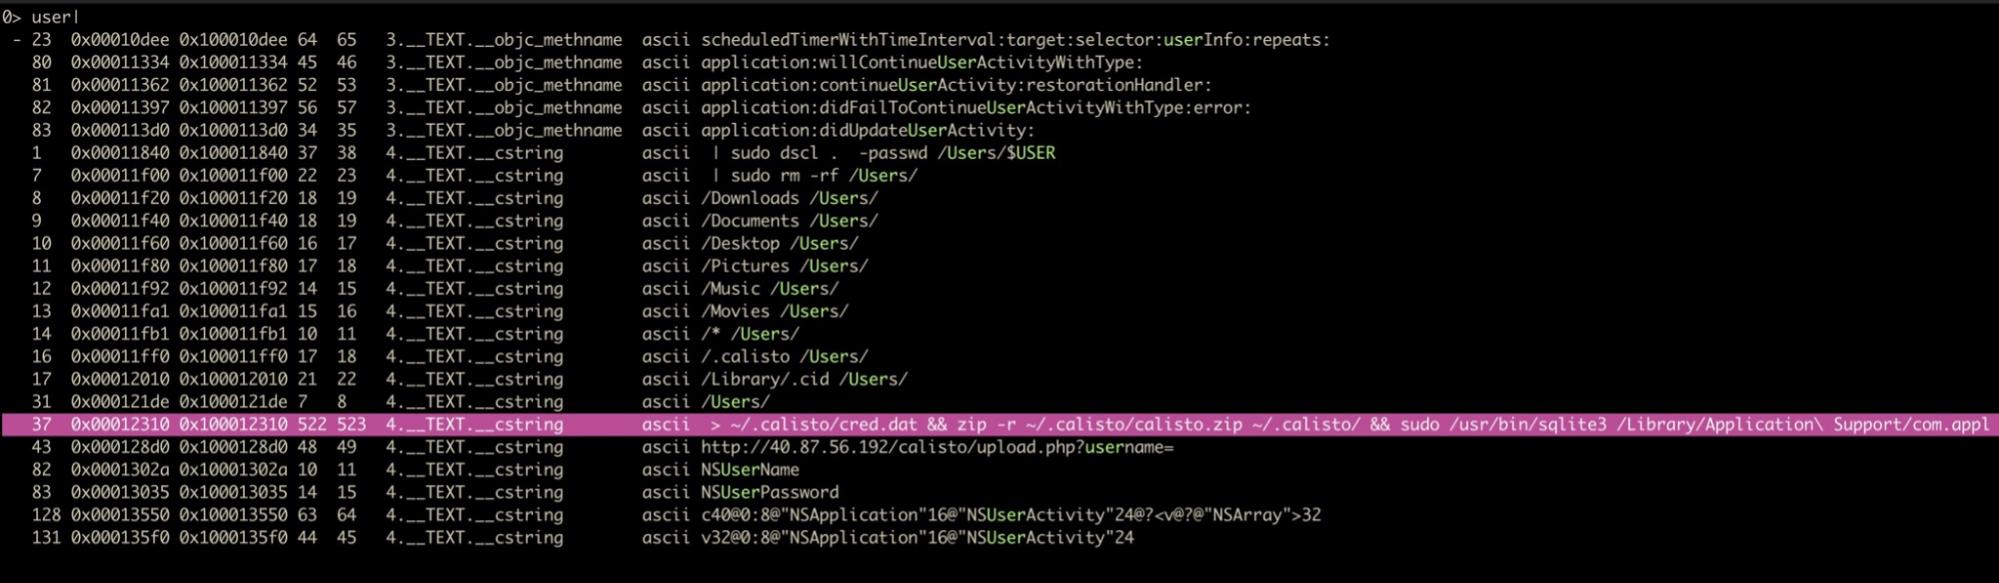
The first image above looks like a lead on the malware’s C2 addresses, while the second shows us what looks very much like a path the malware is going to write data to. Both of these are ideal for our IoCs and for hunting, subject to further confirmation.
4. Fast Seek and Disassembly
What we’ve found after just a few short commands and a couple of minutes of triaging our binary is very promising. Let’s see if we can dig a little deeper. Our output from the HUD gives us the addresses of all those strings. Let’s take a look at the address for what looks like uploading exfiltrated data to a C2:
http://40.87.56.192/calisto/upload.php?username="
From the output, we can see that this string is referenced at 0x1000128d0. Let’s go to that address and see what we have. First, double-click the address to select it then copy it with Cmd-C. To escape the HUD, hit ‘return’ so that you are returned to the r2 prompt.
Next, we’ll invoke the ‘seek’ command, which is simply the letter s, and paste the address after it. Hit ‘return’. Type pd (print disassembly) and scroll up in your Terminal window to get to the start of the disassembly.
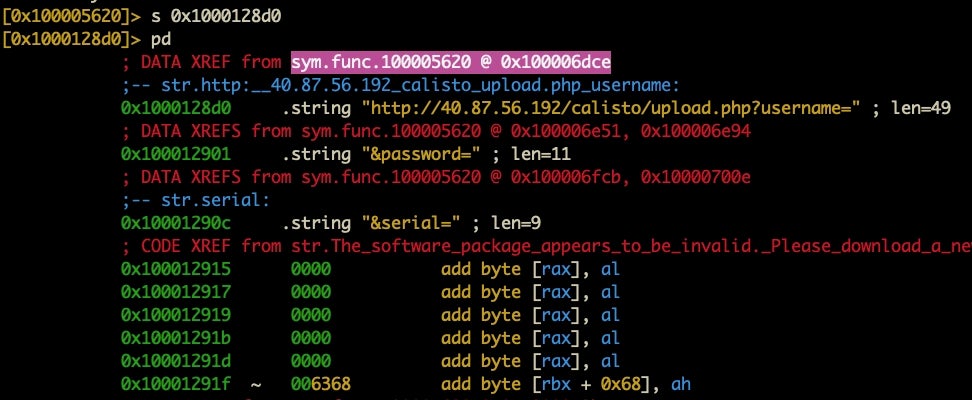
The disassembly shows us where the string is called via the xref at the top. Let’s again select and Cmd-C that address and do another seek. After the seek, this time we’ll do pdf.
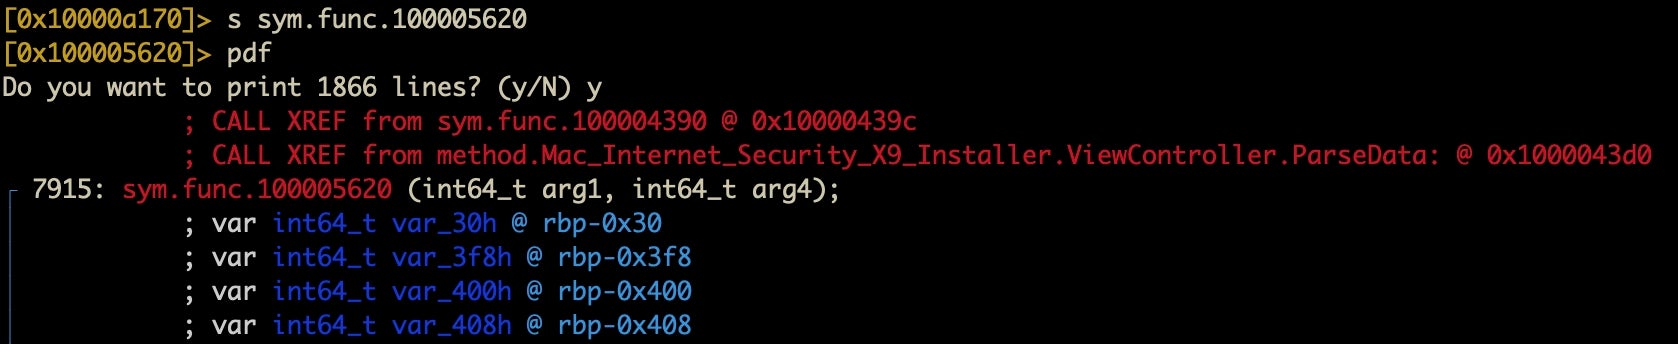
The difference is that pdf will disassemble an entire function, no matter how long it is. On the other hand, pd will disassemble a given number of instructions. Thus, it’s good to know both. You can’t use pdf from an address that isn’t a function, and sometimes you want to just disassemble a limited number of instructions: this is where pd comes in handy. However, when what you want is a complete function’s disassembly, pdf is your friend.
The pdf command gives you exactly what you’d expect from a disassembler, and if you’ve done any reversing before or even just read some r2 intros as suggested above, you’ll recognize this output (as pretty much all r2 intros start with pdf!). In any case, from here you can get a pretty good overview of what the function does, and r2 is nicer than some other disassemblers in that things like stack strings are shown by default.
You might also like to experiment with pdc. This is a “not very good” pseudocode output. One of r2’s weakpoints, it has to be said, is the ability to render disassembly in good pseudocode, but pdc can sometimes be helpful for focus.
Finally, before we move on to the next tip, I’m just going to give you a variation on something we mentioned above that I often like to do with pdf, which is to grep the calls out of it. This is particularly useful for really big functions. In other words, try
pdf~call
for a quick look at the calls in a given function. You can also get r2 to give you a summary of a function with pds.
5. Rabin2 | Master of Binary Info Extraction
When we discussed strings, I mentioned the izz command, which is a child of the iz command, which in turn is a child of r2’s i command. As you might have guessed, i stands for information, and the various incantations of i are all very useful while you’re in the middle of analysis (if you happen to forget what file you are analyzing, i~file is your friend!).
Some of the useful variants of the i command are as follows:
- get file metadata [
i] - look at what libraries it imports [
ii] - look at what strings it contains [
iz] - look at what classes/functions/methods it contains [
icc] - find the entrypoint [
ie]
However, for rapid triage, there is a much better way to get a bird’s eye view of everything there is to know about a file. When you installed r2, you also installed a bunch of other utilities that r2 makes use of but which you can call independently. Perhaps the most useful of these is rabin2. In a new Terminal window, try man rabin2 to see its options.
While we can take advantage of rabin2’s power via the i command in r2, we can get more juice out of it by opening a separate Terminal window and calling rabin2 directly on our malware sample. For our purposes, focused as we are in this post on rapid triage, the only rabin2 option we need to know is:
% rabin2 -g <path_to_binary>
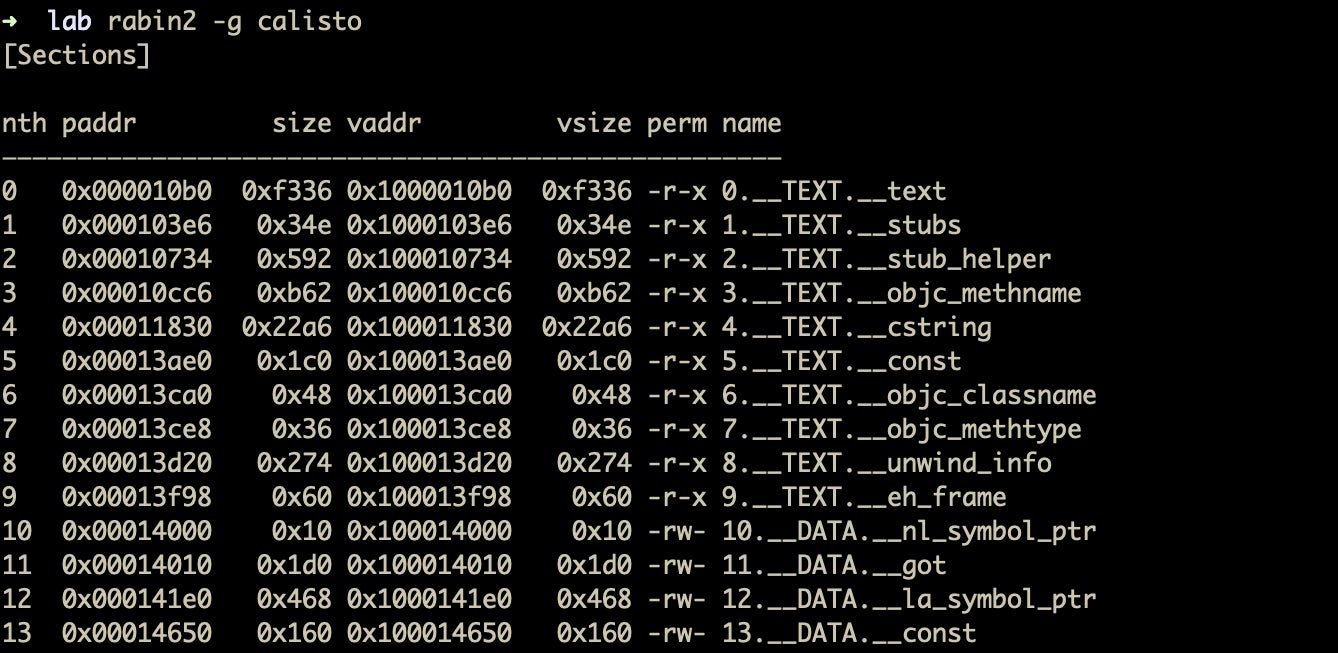
The -g option outputs everything there is to know about the file, including strings, symbols, sections, imports, and such things like whether the file is stripped, what language it was written in, and so on. It is essentially all of the options of r2’s i command rolled into one (if it’s possible to make r2 punch out all of that in one command, I’m not aware of how).
Strangely, one of the best outputs from rabin2 is when its -g option outputs almost nothing at all! That tells you that you are almost certainly dealing with packed malware, and that in itself is a great guide on where to go next in your investigation (we’ll be looking at packed files in a later post).
Meanwhile, it’s time to introduce our last rapid analysis pro trick, Visual Graph mode!
6. Visual Graph Mode
For those of you used to a GUI disassembler, if you’ve followed this far you may well be thinking… “ahuh…but how do I get a function call graph from a command line tool?” A graph is often a make or break deal when trying to triage malware rapidly, and a tool that doesn’t have one is probably not going to win many friends. Fortunately, r2 has you covered!
Returning to our r2 prompt, type VV to enter visual graph mode.
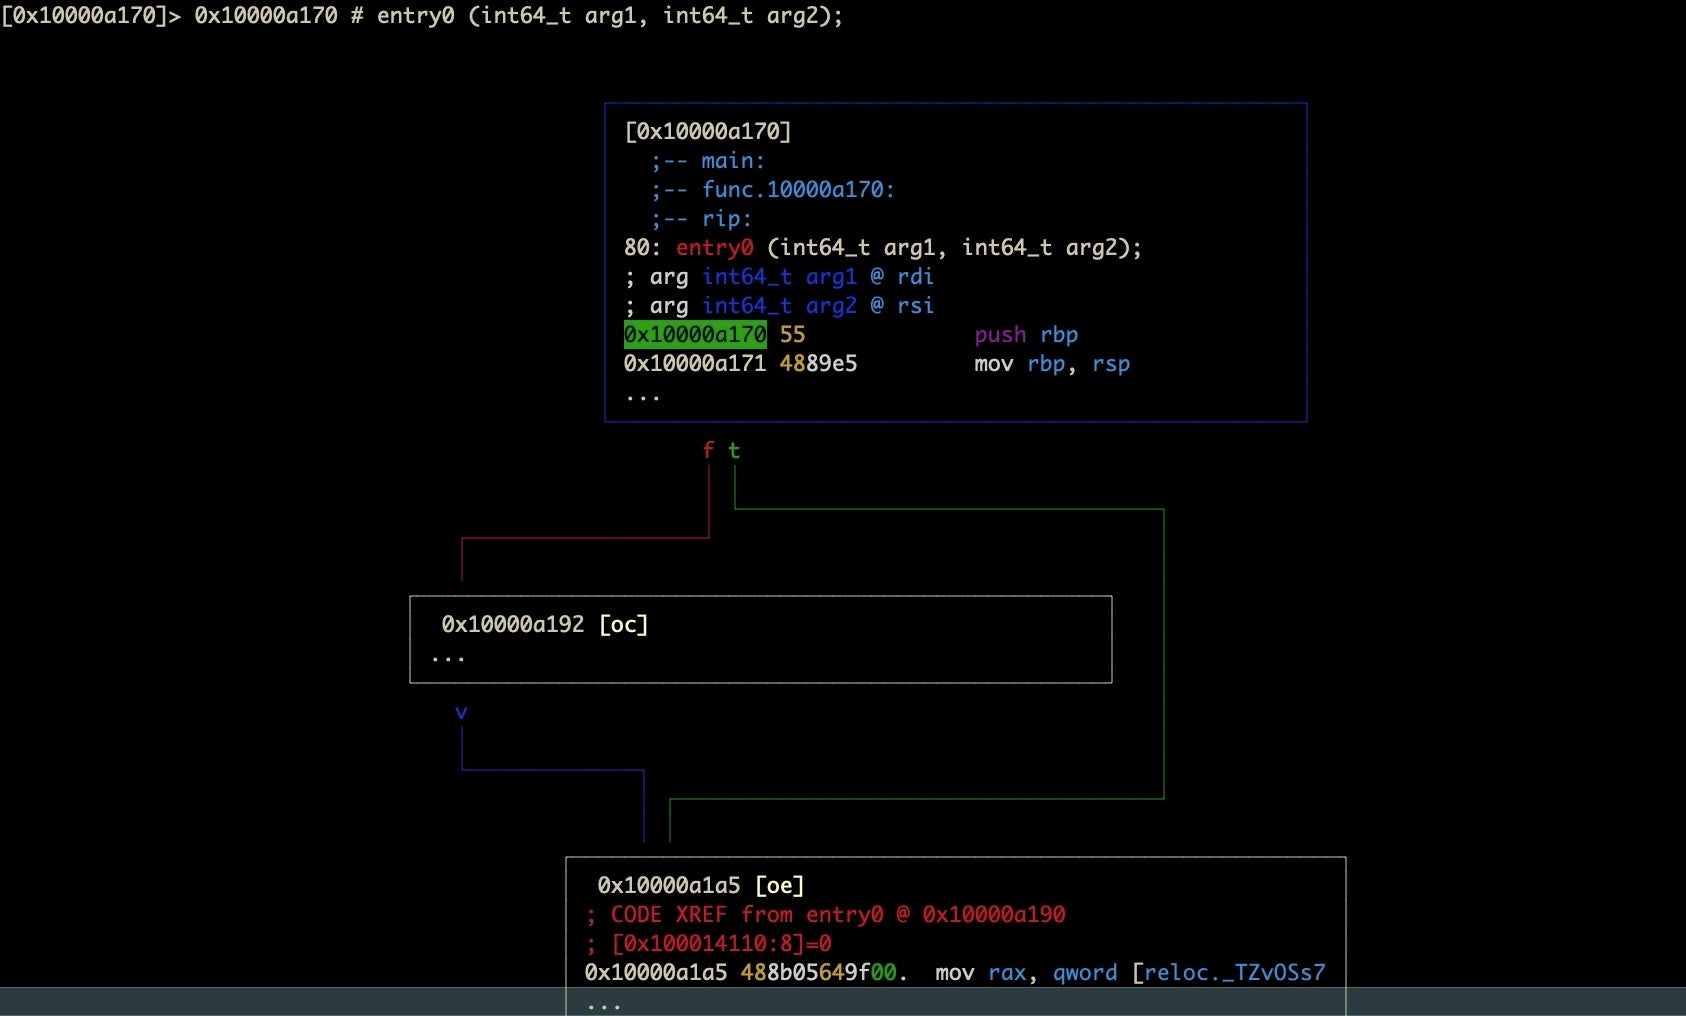
Visual graph mode is super useful for being able to trace logic paths through a malware sample and to see which paths are worth further investigation. I will readily admit that learning your way around the navigation options takes some practice. However, it is an extremely useful tool and one which I frequently return to with samples that attempt to obstruct analysis.
The options for using Visual Graph mode are nicely laid out in this post here. Once you learn your way around, it’s relatively simple and powerful, but it’s also easy to get lost when you’re first starting out. Like Vi and Vim, inexperienced users can sometimes find themselves trapped in an endless world of error beeps with r2’s Visual Graph mode. However, as with all things in r2, whenever you find yourself “stuck”, hit q on the keyboard (repeatedly, if needs be). If you find yourself needing help, hit ?.
I highly recommend that you experiment with the Calisto sample to familiarize yourself with how it works. In the next post, we’ll be looking in more detail at how Visual Graph mode can help us when we tackle anti-analysis measures, so give yourself a heads up by playing around with it in the meantime.
Conclusion
In this post, we’ve looked at how to use radare2 to quickly triage macOS malware samples, seen how it can easily be integrated with other command line tools most malware analysts are already familiar with, and caught a glimpse of its visual graph mode.
There’s much more to learn about radare2 and macOS malware, and while we hope you’ve enjoyed the tips we’ve shared here, there’s many more ways to use this amazing tool to achieve your aims in reversing macOS malware. We hope you’ll join us in the next post in this series as we continue our exploration of intermediate and advanced macOS malware analysis techniques.