
In previous posts, we’ve looked at how malware persists on macOS, taken a practical tour of macOS malware hunting techniques and also discussed techniques for reversing macOS malware. One area that we haven’t discussed so far, and which we’ll offer an introduction to in this and subsequent posts, is macOS post-breach or post-infection incident response. We’ll get started today, in Part 1, by explaining how to quickly gather up vital data about file events, system configuration and the machine’s current environment. In later posts in this mini-series on macOS incident response, we’ll look at discovering user activity, retrieving things like browser history, email messages, notifications, and application usage, among other things.
Throughout, we will learn about many of the hidden logs, text files and databases that are littered across both the user and system domains that can reveal suspicious or malicious activity, and we’ll see how to write our own scripts to collect and analyse that data along the way. Although this is a vast subject, we hope this short series will serve as an introduction and give you a taste to learn more, so let’s get started!
Getting Started With Incident Response
When I’m dealing with a Mac that’s known to be compromised, the first step is to consider the client’s situation and the potential nature of the breach. For example, if the device may have been used in a crime or could become part of a criminal investigation, I would recommend the client to use a digital forensics lab that can image the device and recover artefacts from memory without polluting the evidence. This is quite a different process from what we will cover here, which is more akin to a SOC team investigation to determine what an intruder or a malware infection may have done that has not already been logged by detection software. Has there been lateral movement, has data been exfiltrated, has there been system manipulation? Are there other indicators of attack or compromise that we haven’t yet discovered? These are the questions that we want to set out to answer as quickly as possible in order to protect the business.
Let’s assume for the purposes of our scenario, then, that an employee has brought us a machine after discovering and removing a malware infection. The machine is still powered on, and we have the necessary credentials (and authority) to examine the machine fully.
Say Hello to Sysdiagnose
With that out of the way, let’s set about collecting some initial information. Typically, investigators will want to list things like the system version, currently running processes, network configuration, Bluetooth set up, mounted volumes, install history, system log and much more besides. You could invest quite some time writing your own custom scripts to collect that and other information (we’ll do a bit of custom script writing later in this series), but if you have direct access to the machine you can save yourself a lot of work by leveraging the built-in sysdiagnose tool provided by Apple.
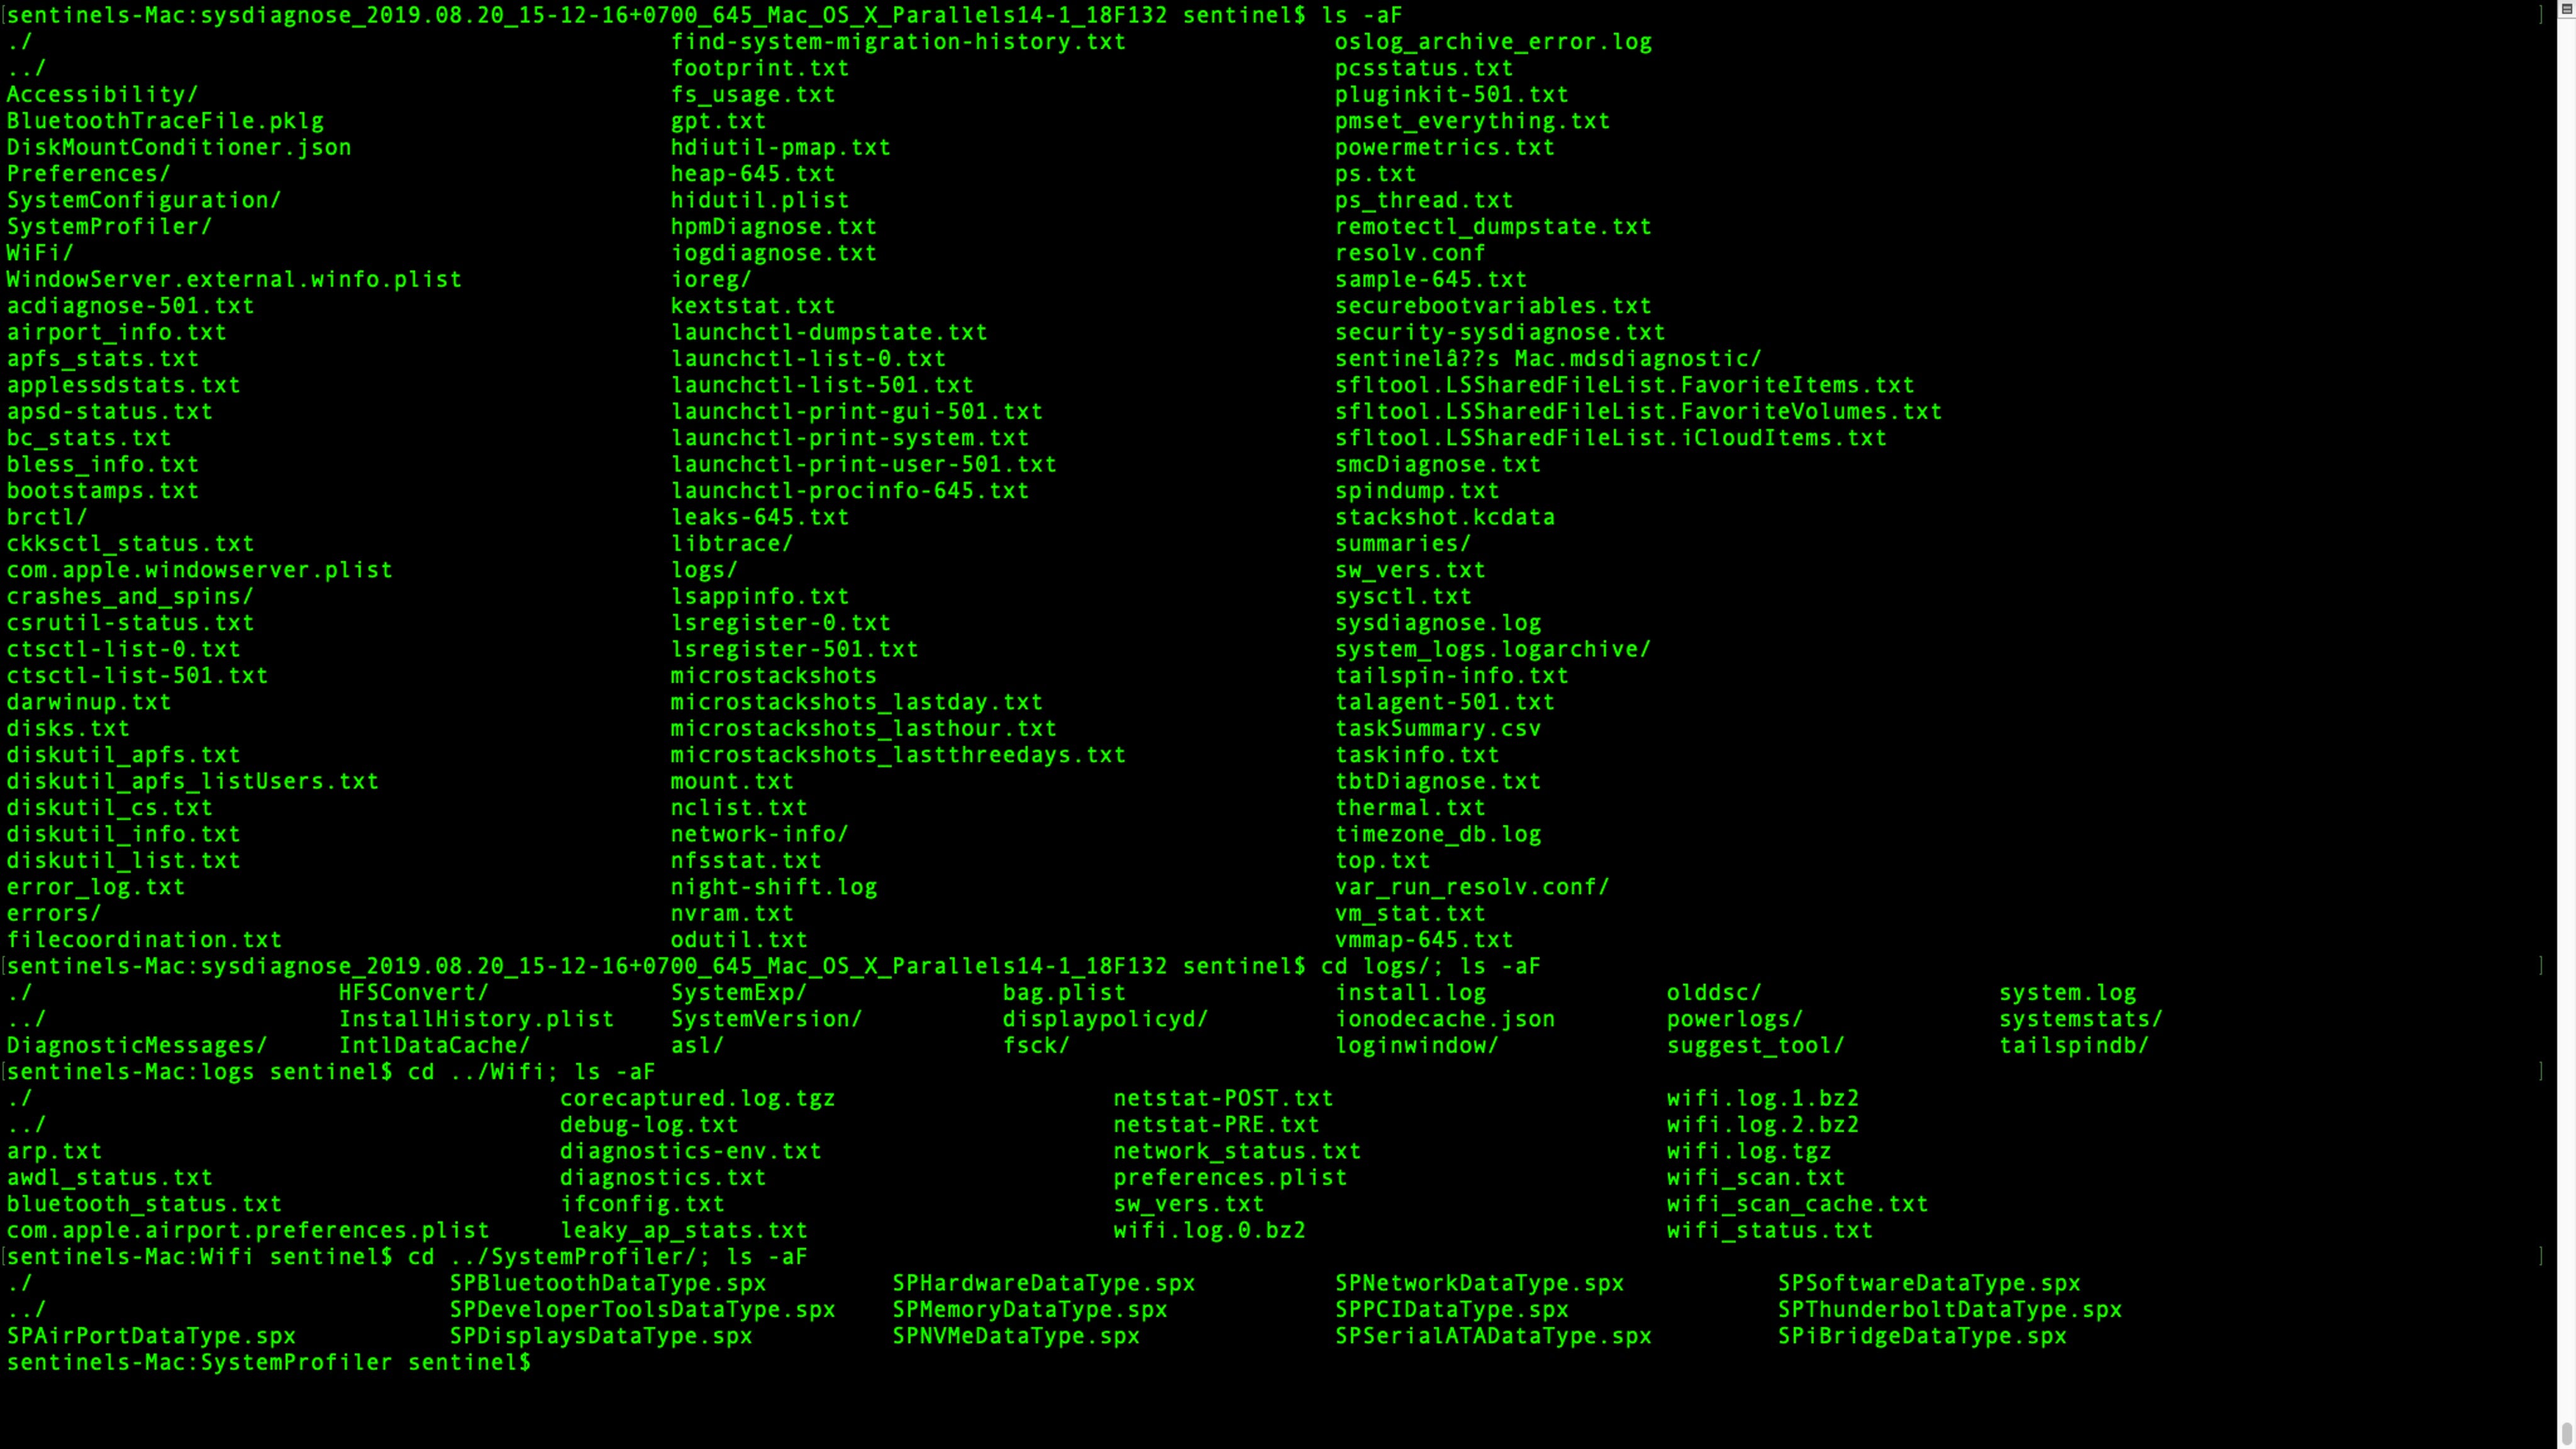
The sysdiagnose tool was not designed for security or incident response purposes. Apple wrote it for macOS beta testers as a means of collecting just about everything they could ever want to know about a Mac when investigating OS bug reports. But for that reason, it’s ideal for our purposes, too. Here’s an image showing just some of the data that it collects.
What’s even nicer, from the point of convenience, is that if you have physical access to the machine you can kickoff the report simply by pressing this keychord:
Control-Option-Command-Shift-Period
If you get it right, you’ll see the display briefly flash indicating that the process has begun.
If using the keychord is a problem for any reason, head over to the Terminal app. There are a bunch of command line options you can specify (see man sysdiagnose page), but for our purposes we will just run it in vanilla mode. Enter the following, type the admin password, and confirm that you want to proceed when prompted:
$ sudo sysdiagnose
In this case you will not see the display flash.
Regardless of which way you invoke the tool, it’ll take a few minutes to complete, so you might want to take the opportunity to make a coffee, walk the dog, feed the cat, or while away the time as you see fit until sysdiagnose has done its thing.
Exploring Files Collected by Sysdiagnose
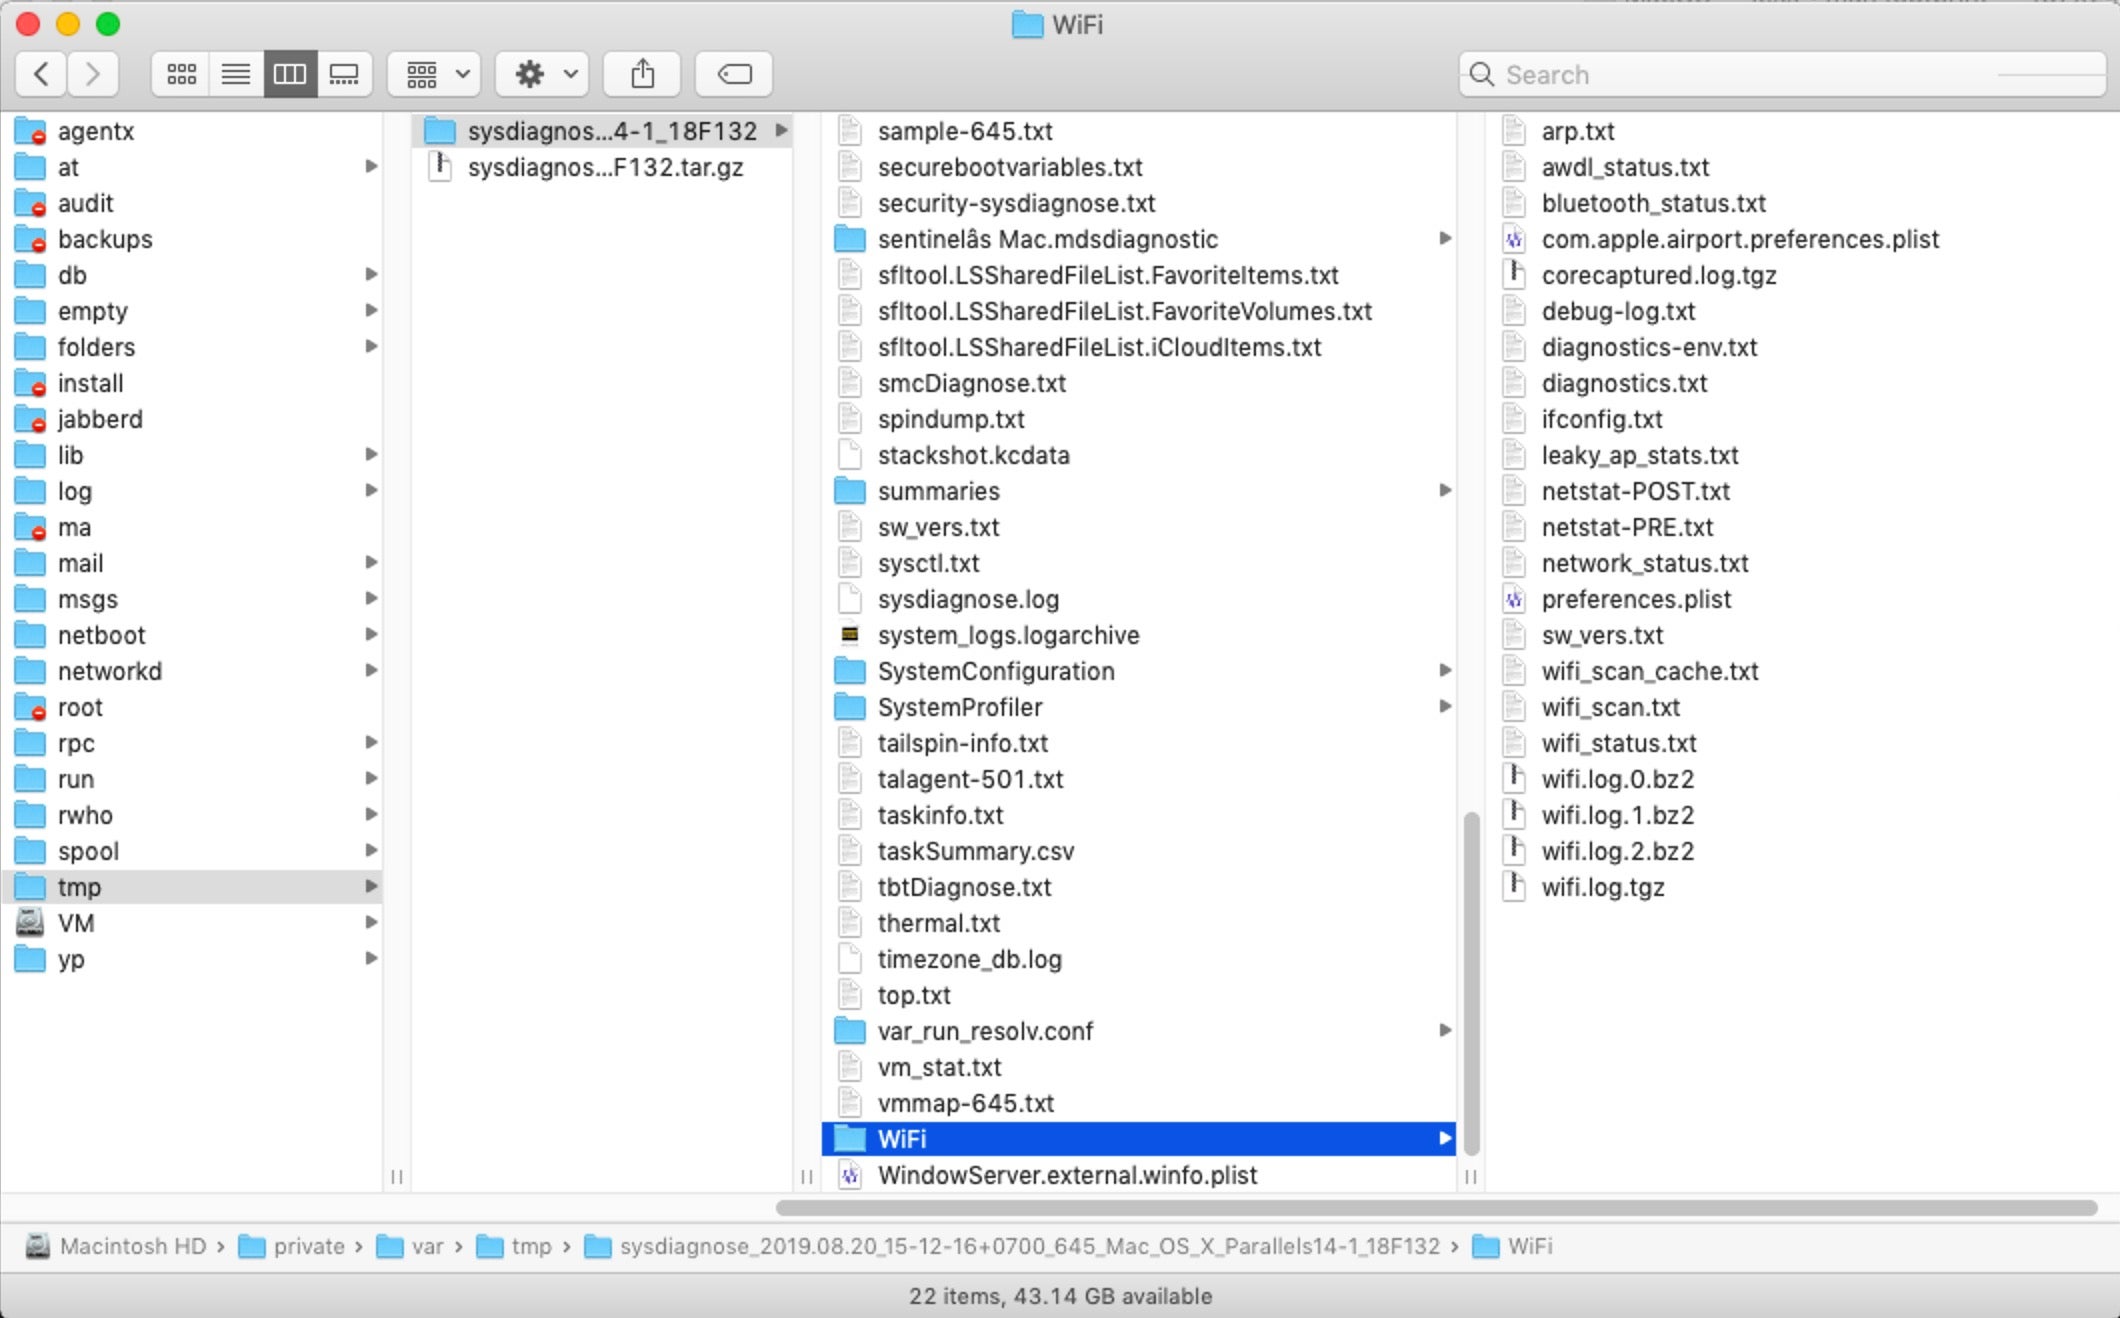
When sysdiagnose has finished, it’ll pop a Finder window showing you the compressed result. Copy it off to your local machine, then double-click it to unpack it and have a quick scroll through what’s been collected. Yes, there’s a lot of juicy stuff in there: everything from a full ps to netstat, kextstat, system_profiler, top, Wifi scans and much, much more.
When working with large amounts of text files I like to use BBEdit, which offers many useful functions for quickly searching and manipulating multiple files. The features I’ll use are all available in the free version, so if you don’t already have a copy of BBEdit just go ahead and download the free demo. Of course, if you have your own way of working with large sets of files, that’s fine, too.
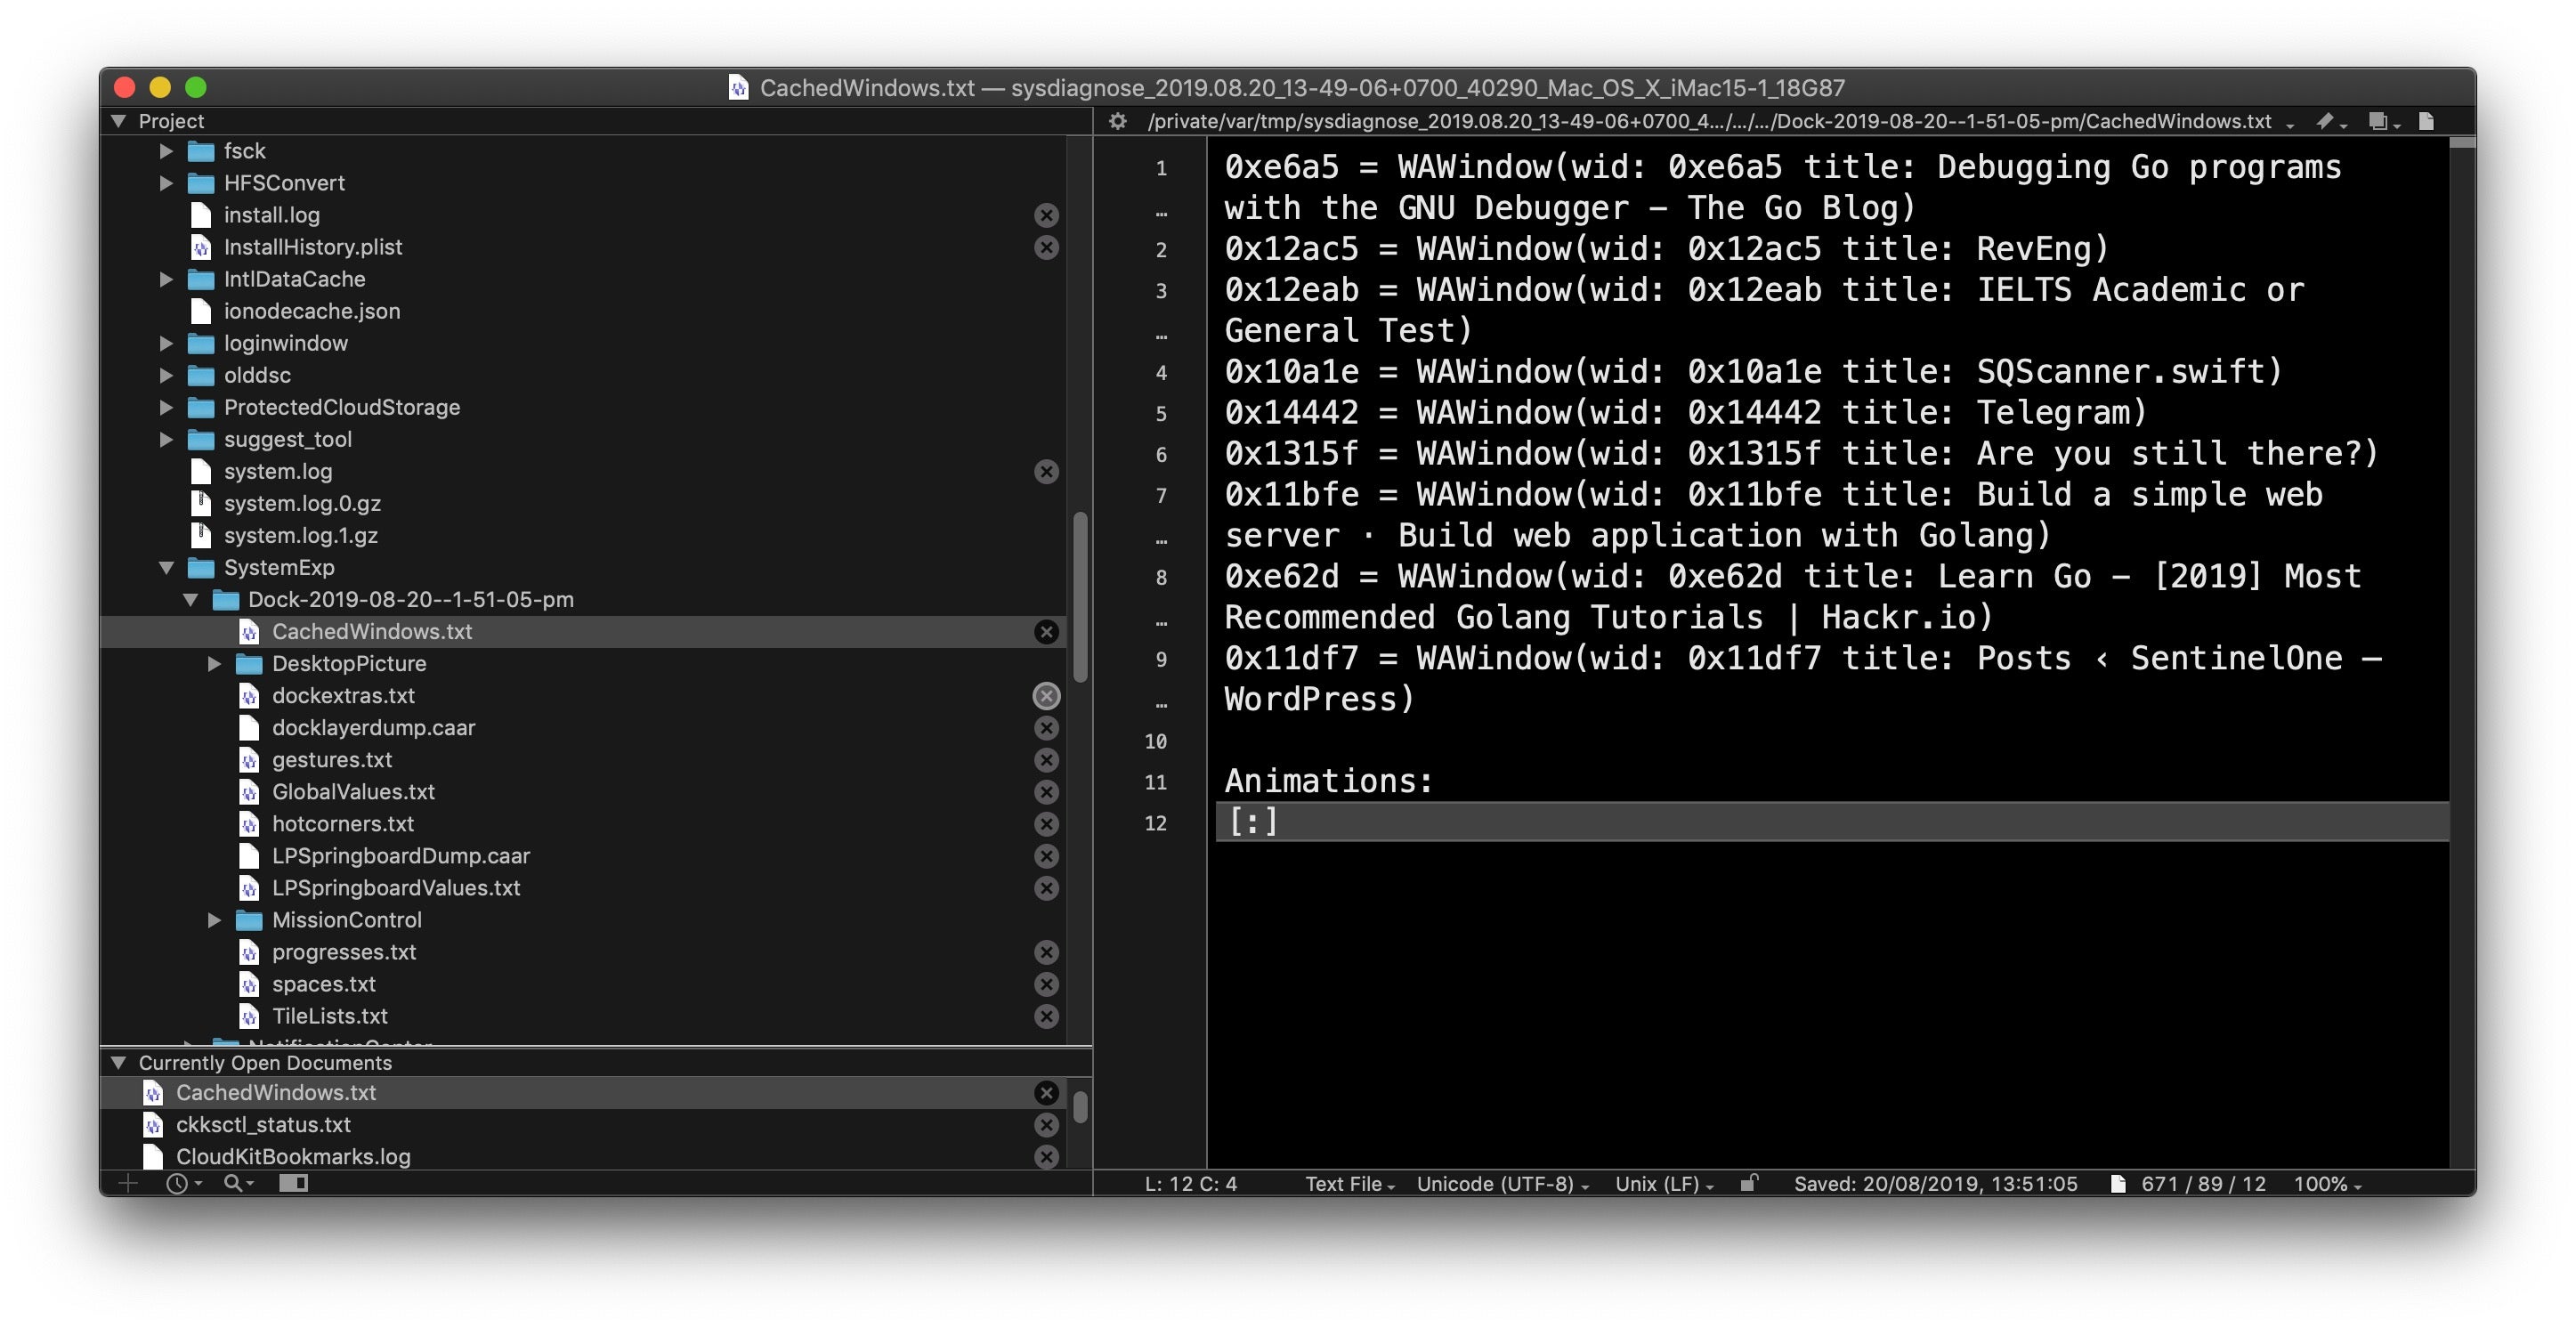
If you have BBEdit in the Dock, grab the sysdiagnose parent folder in the Finder and drag and drop it on top of the BBEdit Dock icon. When the project view opens up, scroll down to the logs folder in BBEdit’s Sidebar, click the disclosure triangle and scroll down again. You should see useful things like Install.log and InstallHistory.plist among many other goodies.
Still in the logs subfolder, find the folder SystemExp, descend into that and open up the folder named “Dock” (followed by a date and timestamp). In here, you’ll find useful stuff such as CachedWindows.txt, which might tell you a little about the user’s recent activity (although much more to come on that in the following post!).
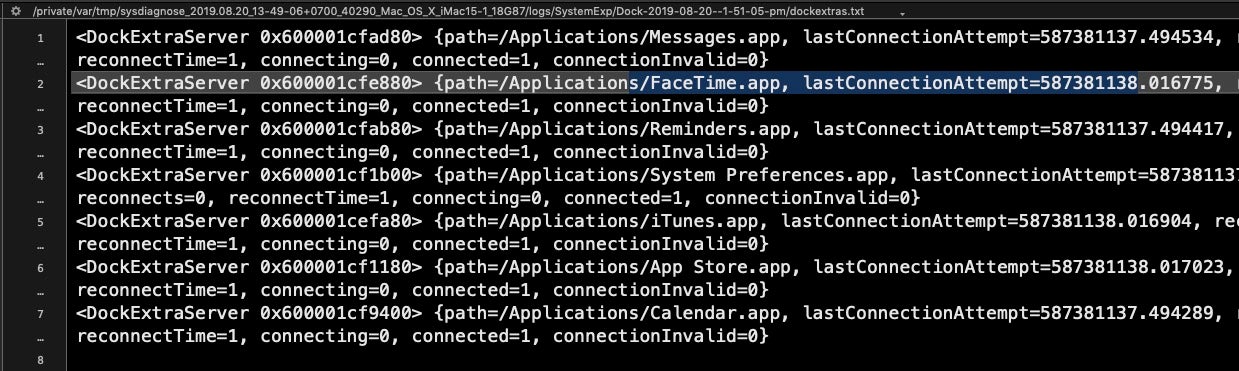
Also, take a look at dockextras.txt file, which may include info on things like the last time the user connected to Facetime, Messages and a bunch of other apps.
Interlude – A Note About Timestamps
Before we move on, a note about the timestamps you see here, as you’ll encounter these elsewhere in macOS logs. Timestamps like this
587381138.016775
may look like Unix epoch timestamps (that is, seconds since 1/1/1970), but if you try to convert them using Unix epoch time you’ll get nonsense dates. These are actually Cocoa timestamps, which are similar but the seconds are counted since 1/1/2001. To convert them, add the difference between Unix and Cocoa start dates in seconds (that’s a fixed integer of 978307200) and use the date command line utility with the -r switch. We remove the fraction of a second and just deal with the whole integer, like so:
$ date -r $((587381137 + 978307200))
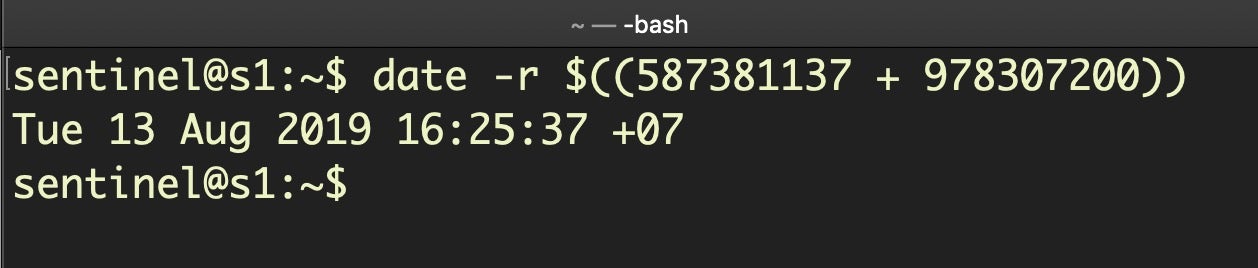
That returns the more human-friendly date of Tue 13 Aug 2019 16:25:37 +07 from the Cocoa timestamp.
Finding Traces of Malicious Activity
Just below the logs folder you should see a file lsappinfo.txt. Click on it to load it into the main editor window. This file contains a lot of useful data about currently running applications, but even more useful for incident response – when we’re likely faced with a situation where malware has been and gone – is to look in the two files below, the admin (501) and root (0) dumps of lsregister. These are dumps of the databases held by Launch Services and contain detailed information about every application that has been available to the user.
Let’s walk through a practical example of how we might use this information to learn more about an infection.
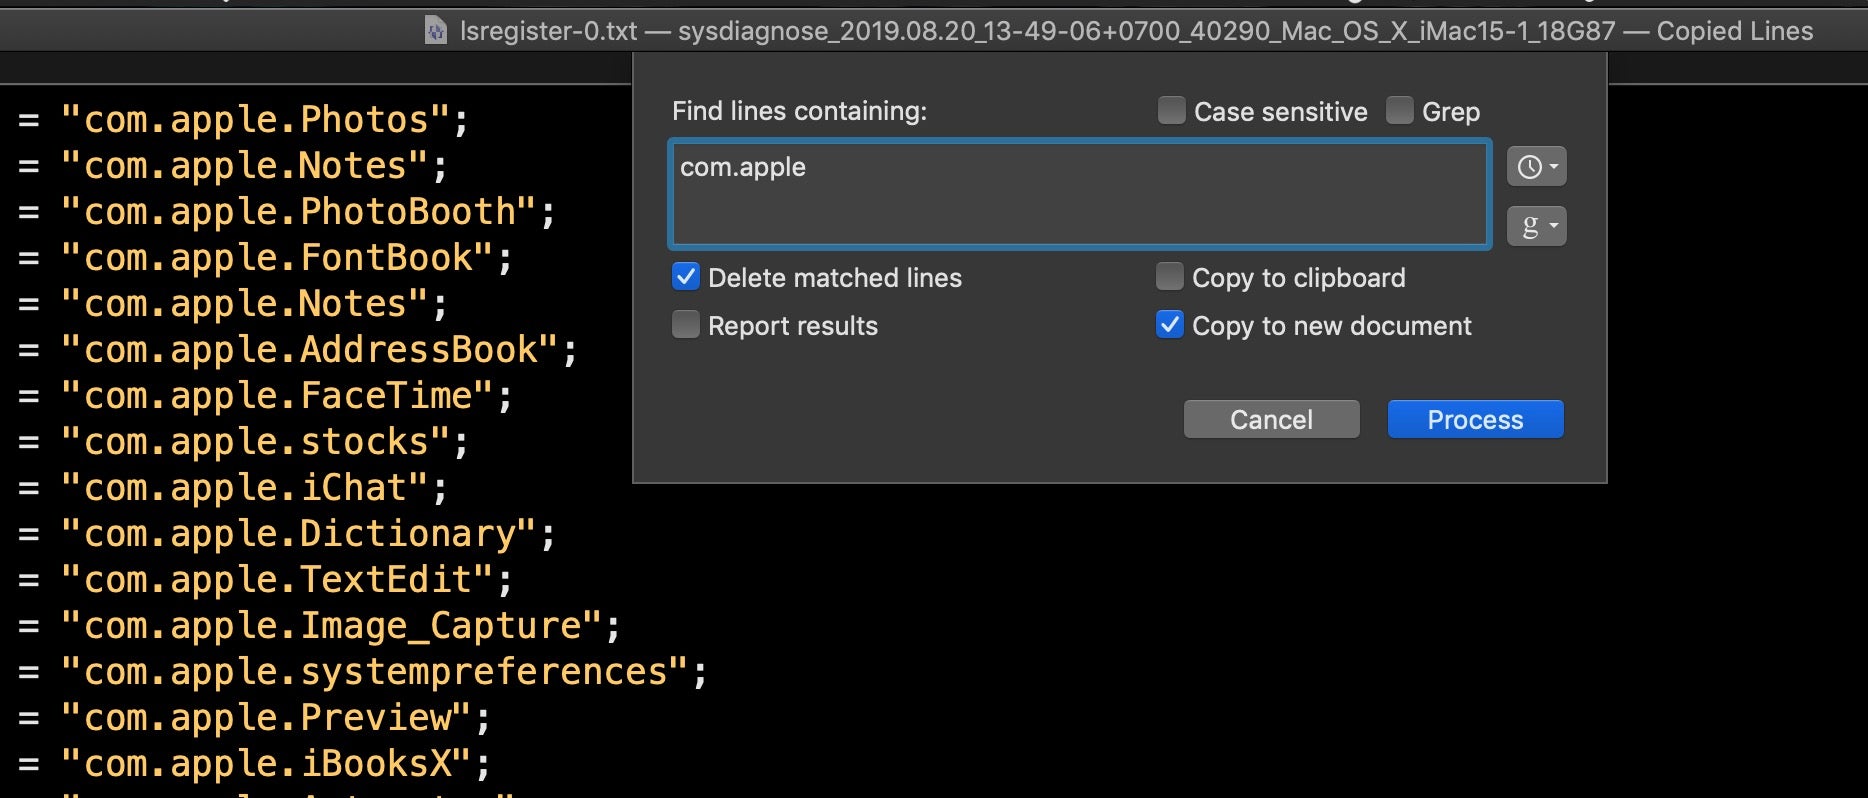
If you scroll through lsregister-0.txt, you’ll notice each record has a path field and many have a CFBundleIdentifier field. To make a cursory examination of this file, I’ll use BBEdit’s ‘Process Lines Containing’ function (from the Text menu) and copy all lines containing CFBundleIdentifier to a new document.
In the resulting text window, I’ll use the same function only this time I’ll delete all lines containing “com.apple” to narrow down my search (as we’ve pointed out before, some malware likes to disguise itself by using the “com.apple” label, so bear that in mind).
On my suspect device, this gives the following results. The highlighted ones will stand out to anyone familiar with macOS malware. There’s a bunch of commodity adware/PUP programs, but the ones in red are particularly interesting.
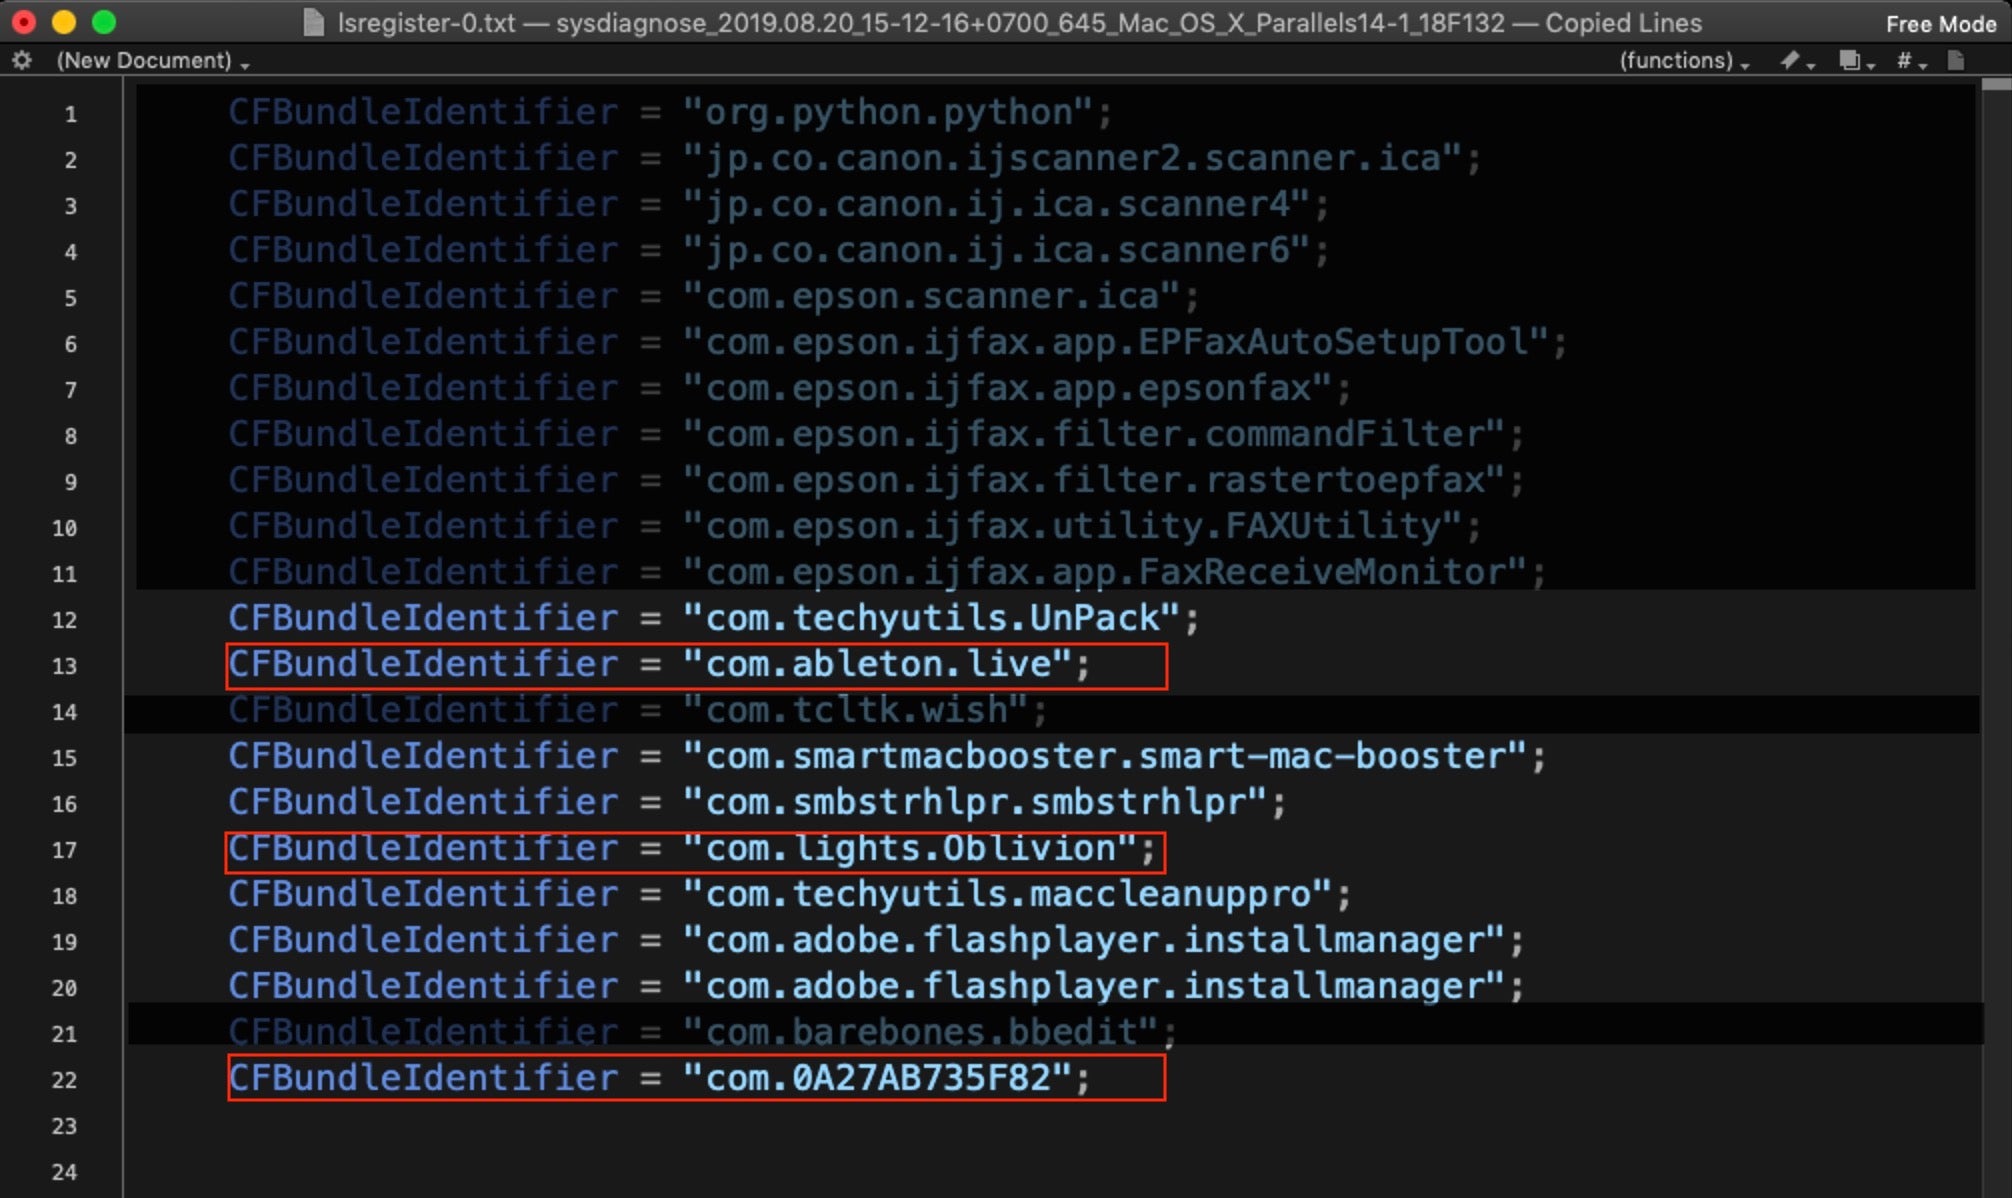
Let’s see what more we can find out about them. We’ll start with the bottom one, since that kind of bundle identifier is a non-standard pattern rarely used by legitimate software. Using BBEdit’s Multi-File Search function (Shift-Command-F), we can rapidly search through all the files collected by sysdiagnose for this identifier and see what else is known about it.
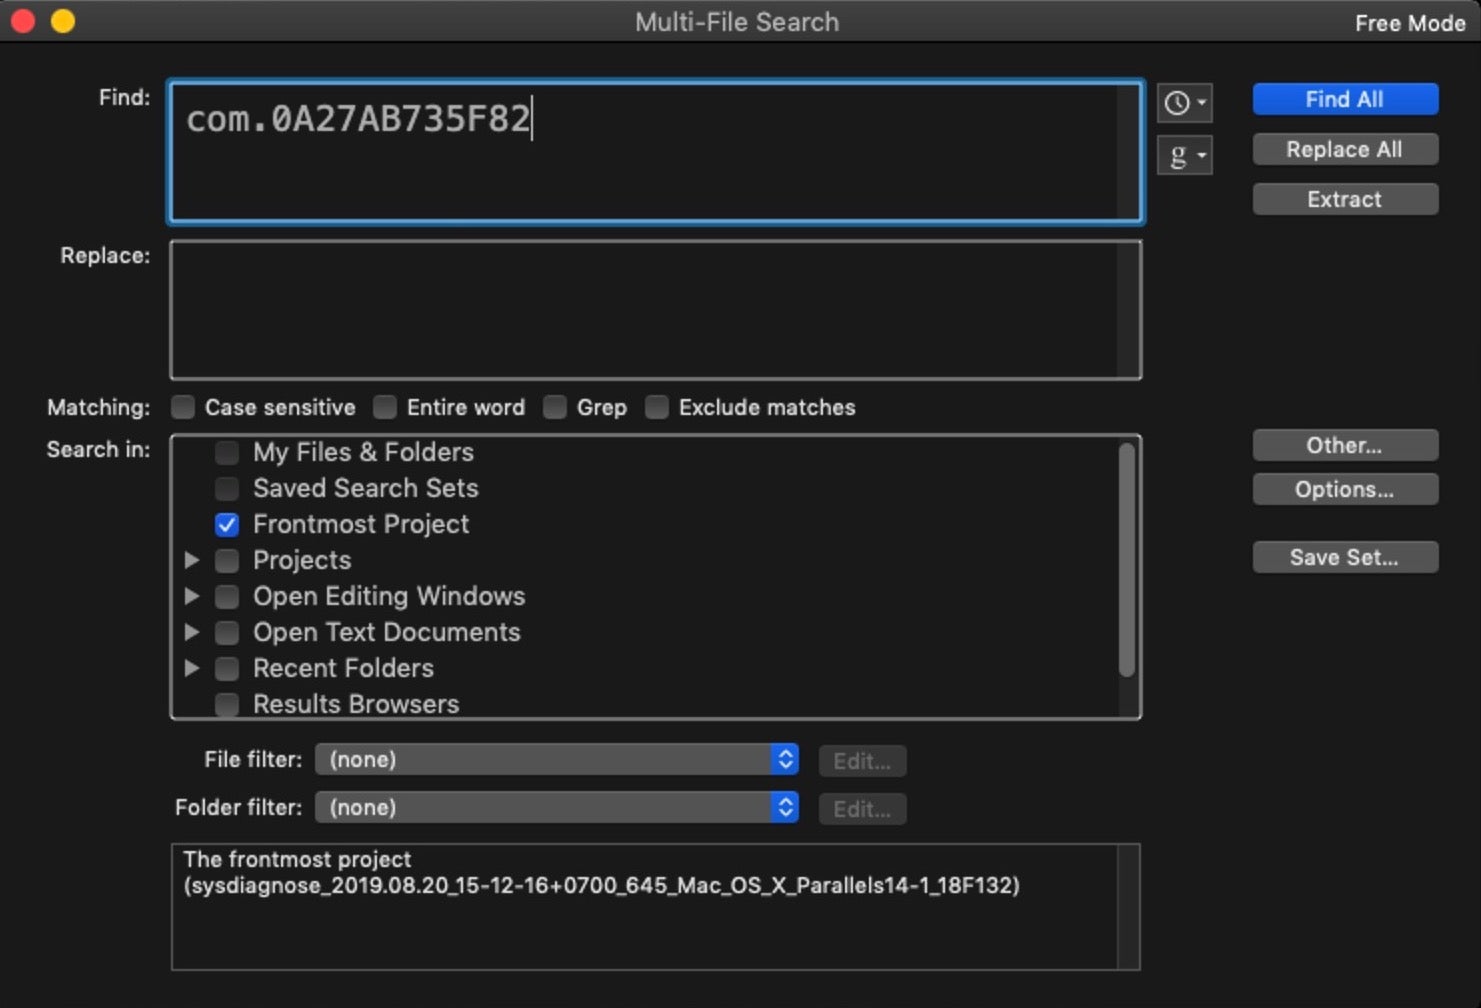
Add the identifier to the “Find” field and choose “Frontmost project” from the “Search in:” panel below. Then click ‘Find All’.
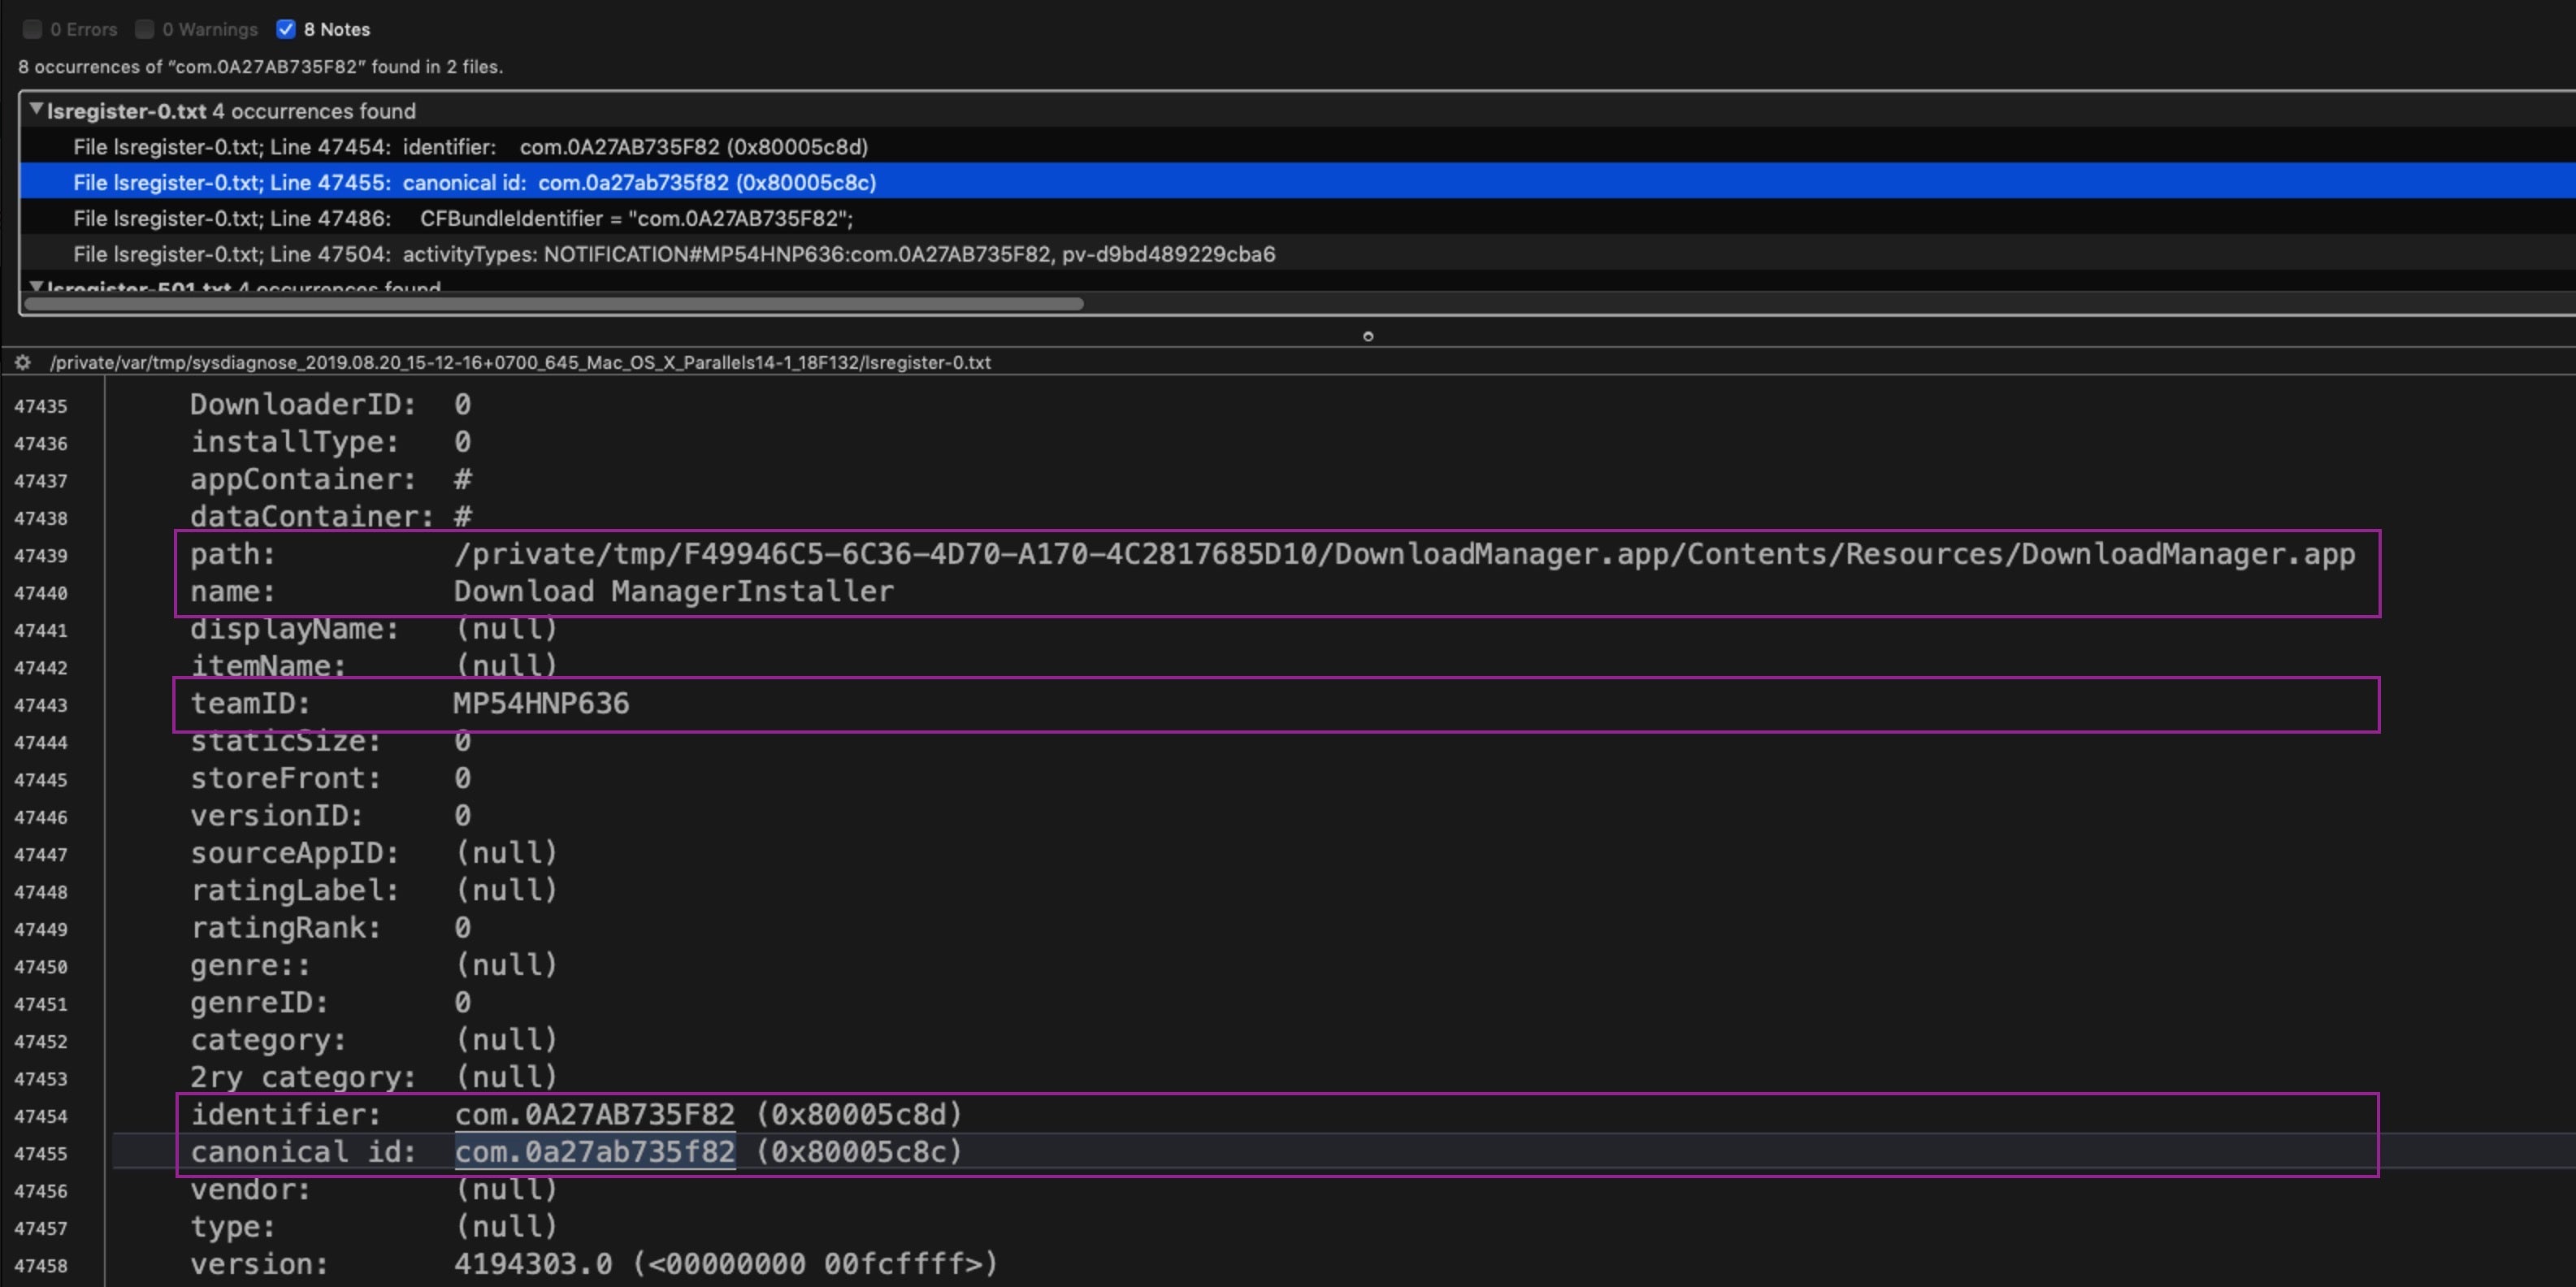
Our search results have revealed the Path, full App Name and team ID (aka “Developer Signature”). But further investigation on the machine shows no evidence the application still exists. After trying searches on VirusTotal and other public search engines, the teamID led us to a Russian-language stackoverflow post.
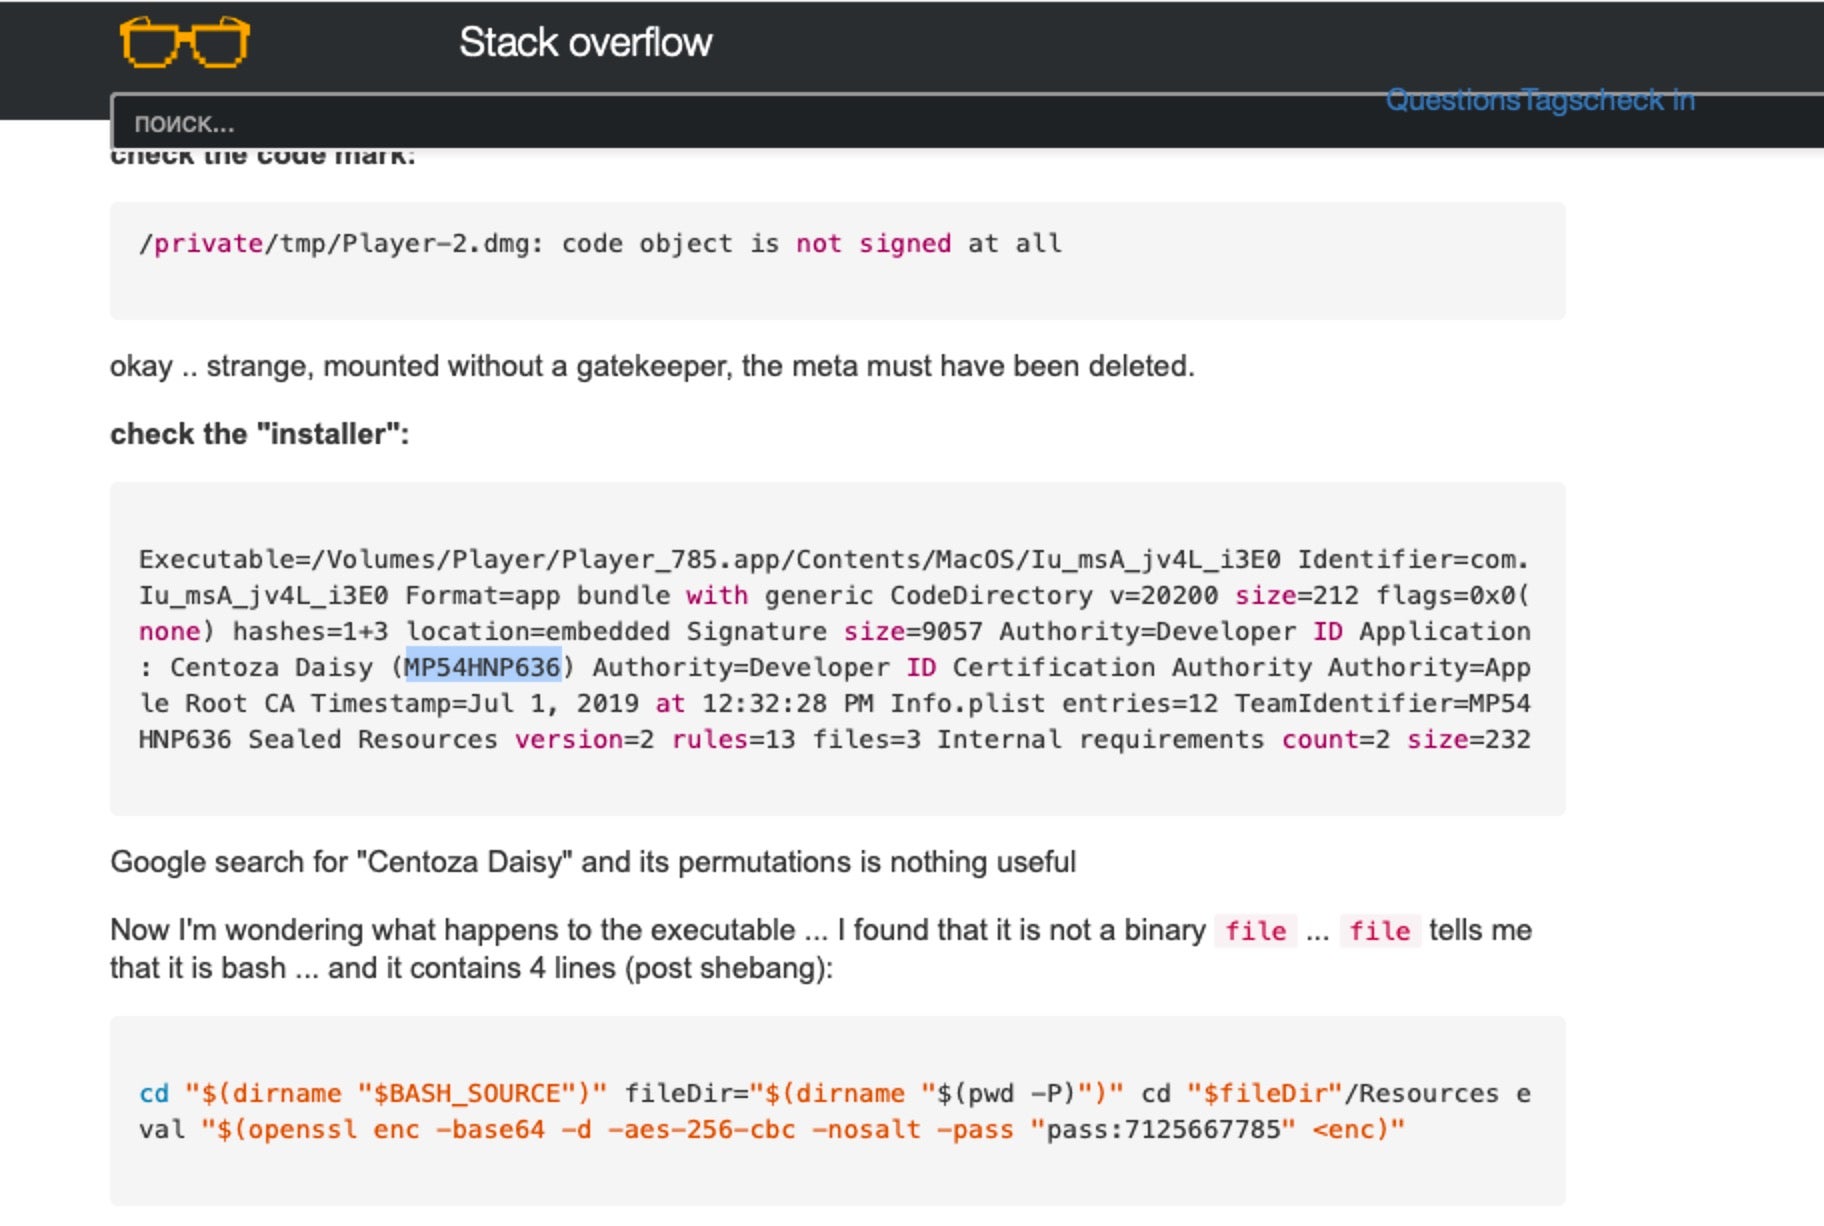
It turns out that the developer signature was used to sign an “app” that was in fact a Bash script bundled in an Application wrapper. It looks very much like a variant of OSX.Shlayer. There’s a high probability that the item found on our machine was a variant of the same malware, given that they were both signed by the same developer.
Returning to our list of labels, note that the second item, com.lights.Oblivion, is a bundle identifier associated with OSX.CrescentCore.
And what about the other highlighted item, com.ableton.live? Ableton Live is a legitimate commercial program, but there’s also cracked versions on the internet that are used for cryptojacking. Again, using the Multi-File search, we can find more info in the sysdiagnose folder. This time a result in the install.log reveals that the app was delivered in an unsigned .pkg. Since there is no chance that a company like Ableton would be distributing their software without proper code signing, there’s a strong likelihood that this package is malware.
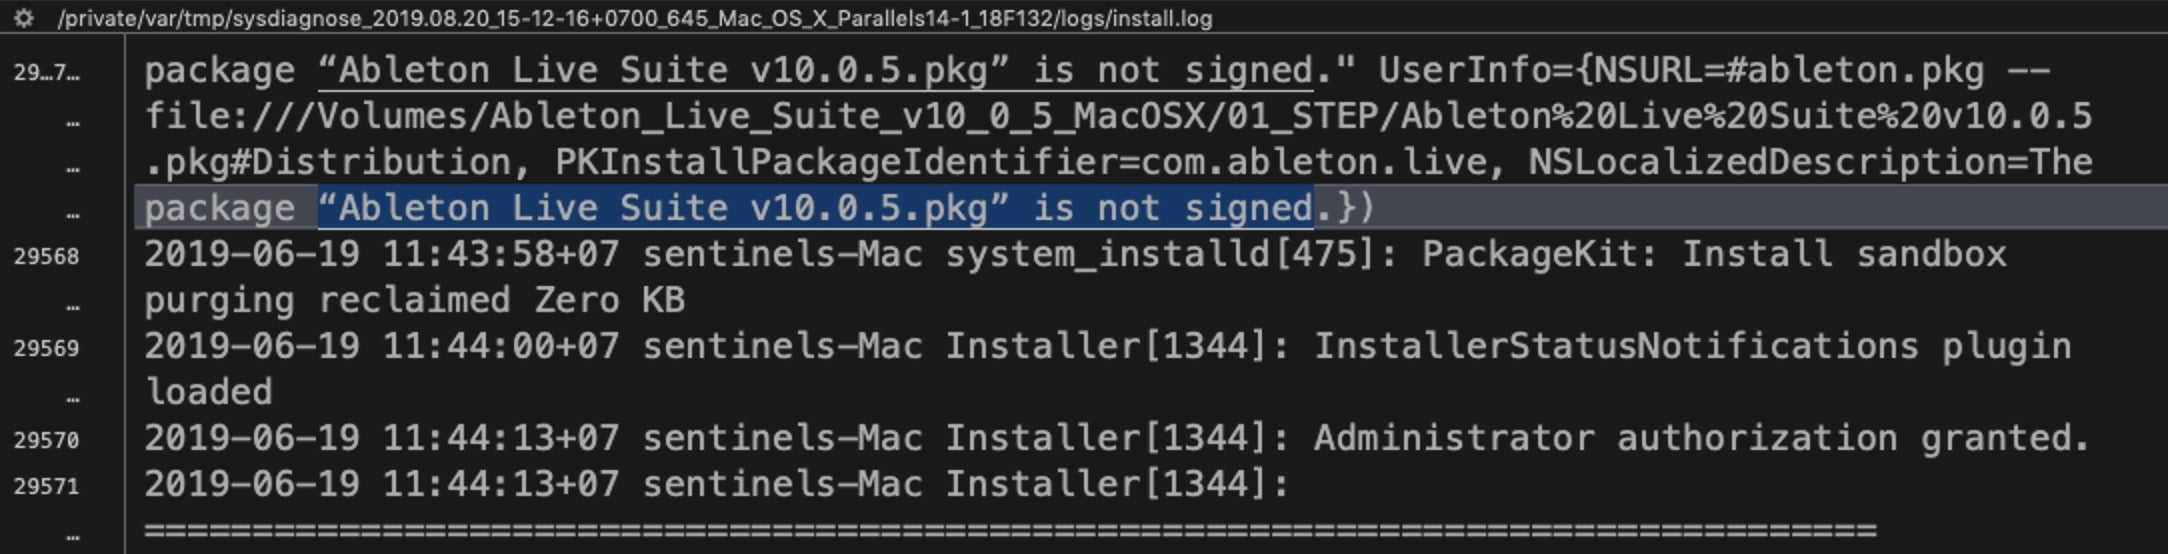
It seems our user’s machine has seen quite a lot of action!
While the above example isn’t particularly methodical, it does hopefully give you an idea of what you can do with such a vast amount of data and a few multi-file searches.
One Log To Rule Them All
Among the many other files worth exploring in the sysdiagnose folder, there is one other that deserves special mention. Scroll down (either in BBEdit or Finder) to a file called system_logs.logarchive.
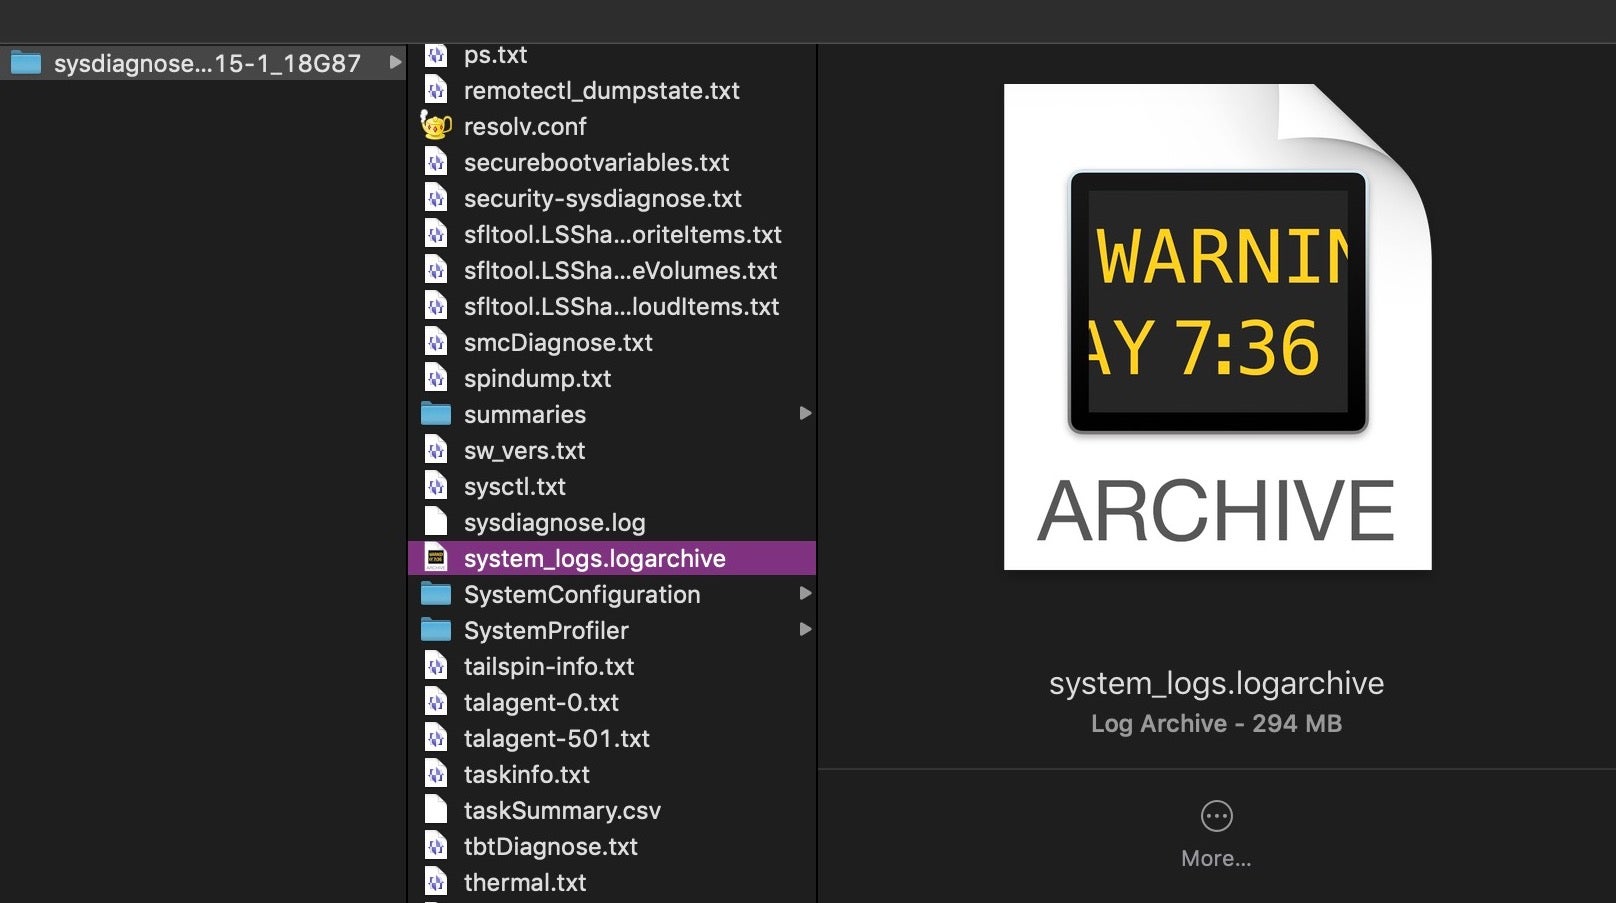
As the name suggests, this is a collection of macOS system logs, the sort that are typically viewed in the Console.app. The file is actually a directory, but its contents are unreadable in BBEdit; however, double-clicking it in BBEdit will open it in the Console.app. You can also read this format with the log command in the Terminal. The latter is a far more powerful and effective tool for investigative work, but it does take a little practice to master. As there are many good guides on the log command, such as here and here, as well as the man page itself, we won’t go into details here. However, there are a couple of oddities about the “unified logging” system that I haven’t seen covered elsewhere and which are worth being aware of.
First, note that the system_logs.logarchive file collected by sysdiagnose only contains a subset of the logs available. You can see the range of information collected by using the stats command. For example,
$ log stats --archive <path to logarchive file> --overview
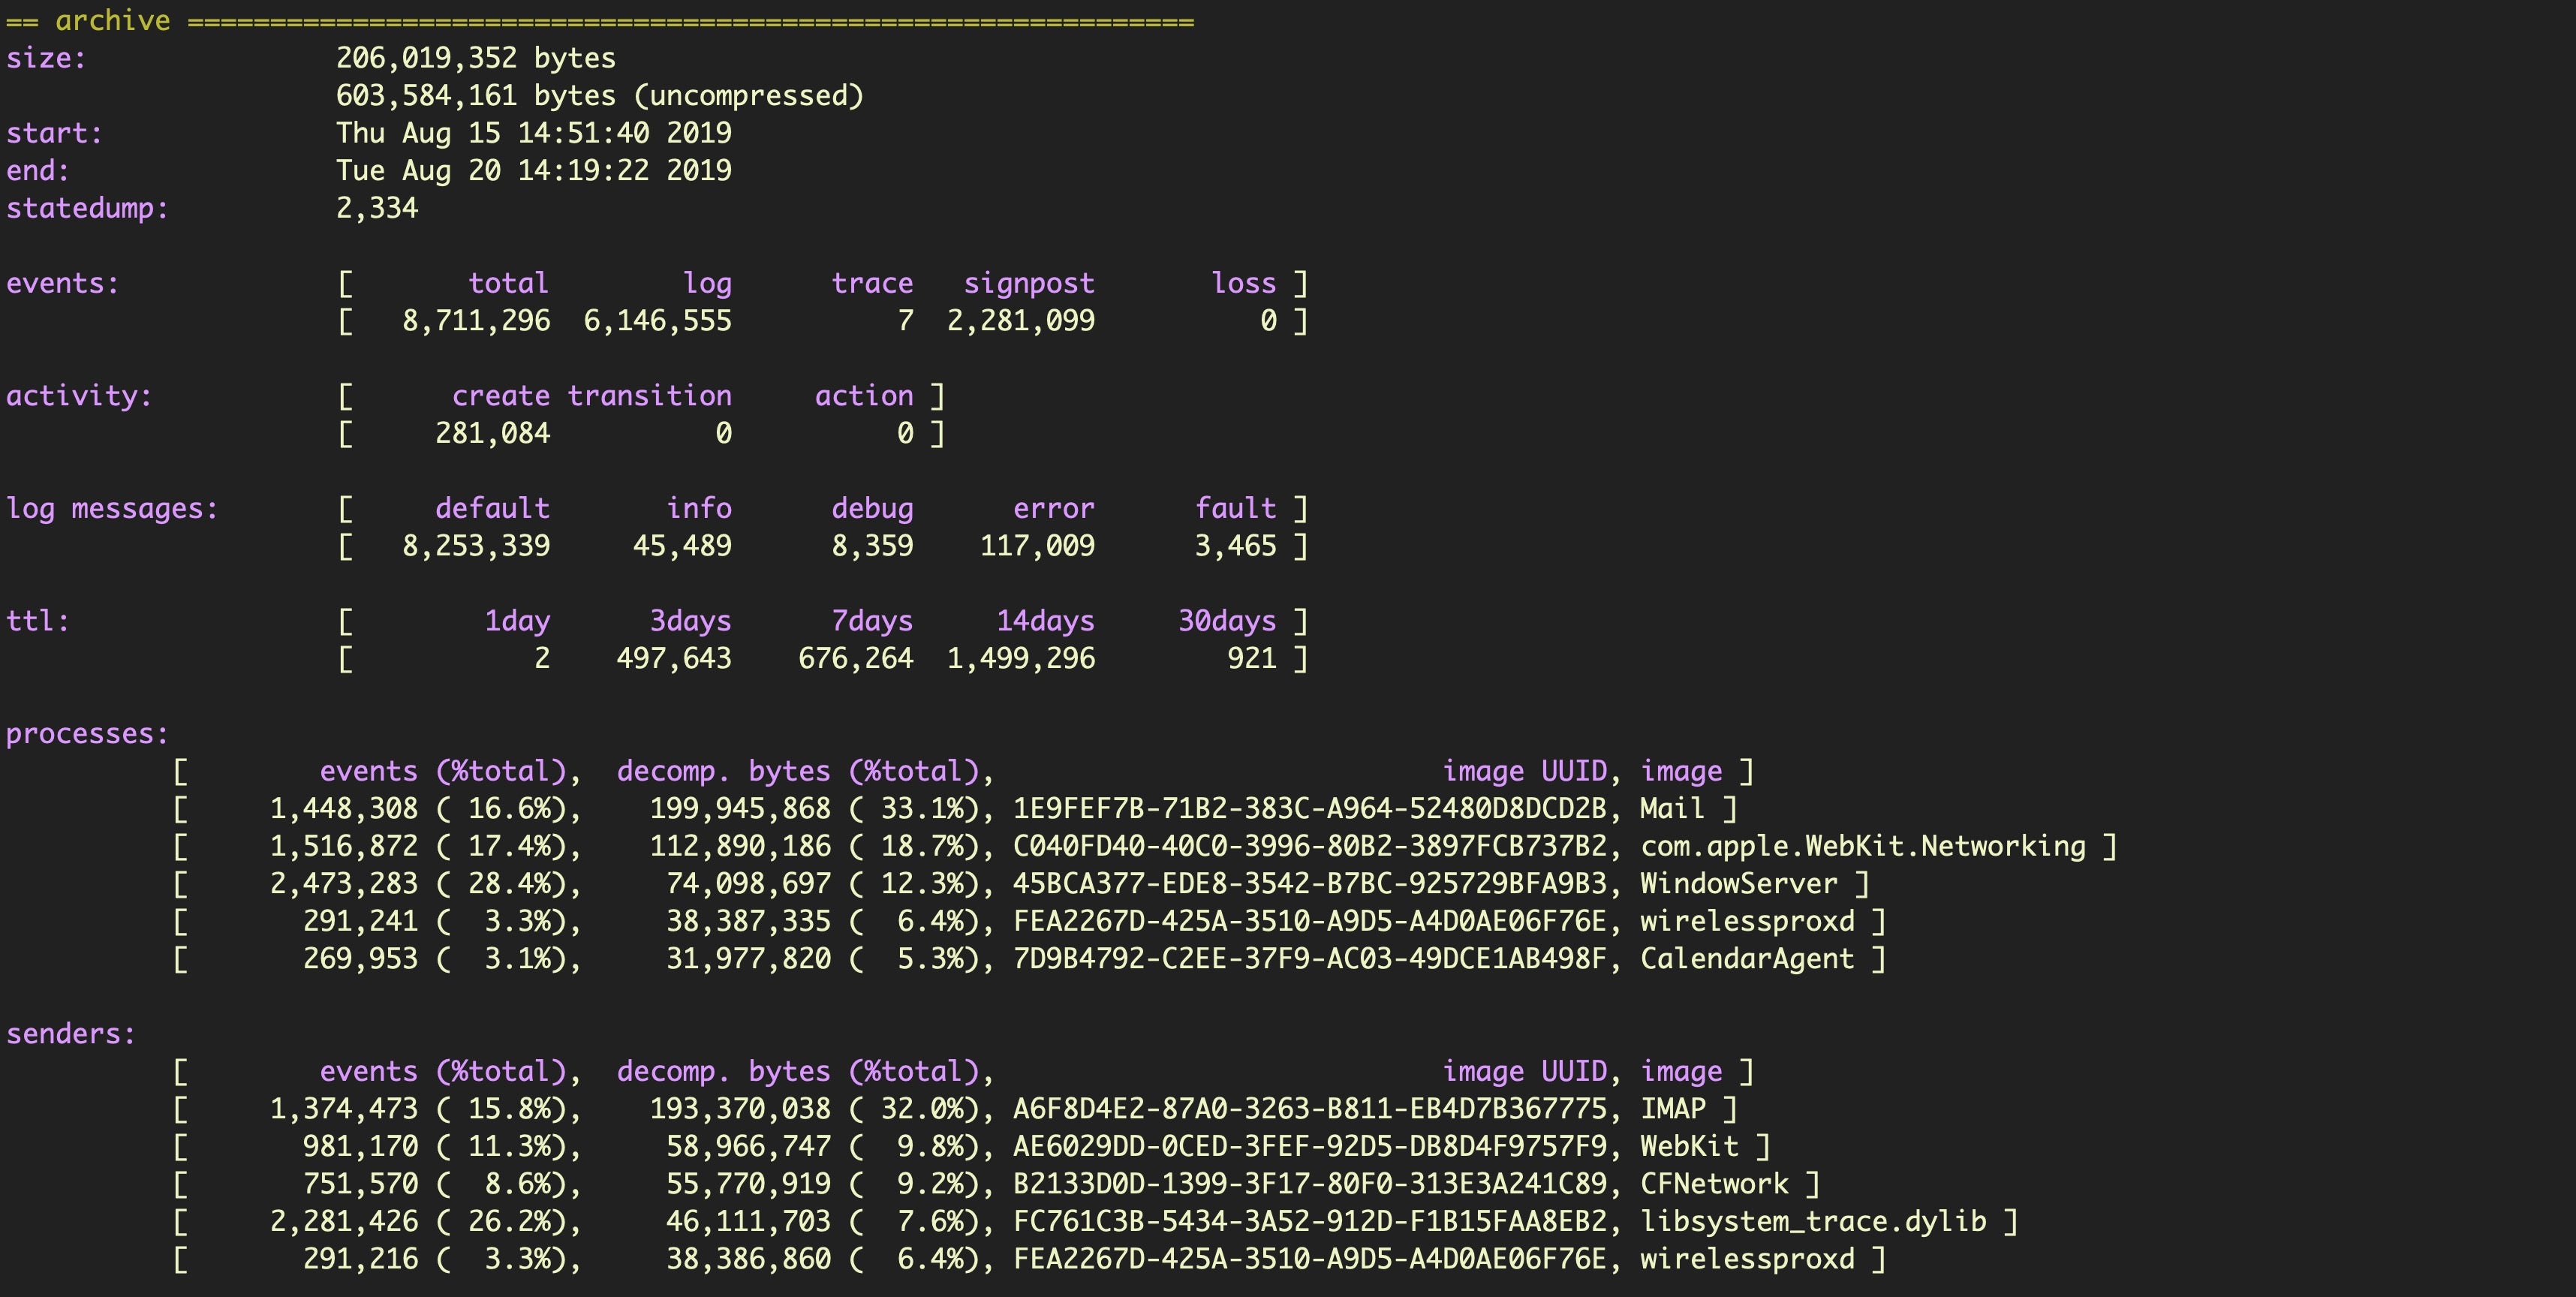
In this case, we see logs collected from August 15th to 20th. Now let’s run the same command on the machine without specifying the name of the logarchive file in the sysdisagnose folder.
$ log stats --overview
With no logarchive file specified, the command returns the stats for the main system log datastore held on the device.
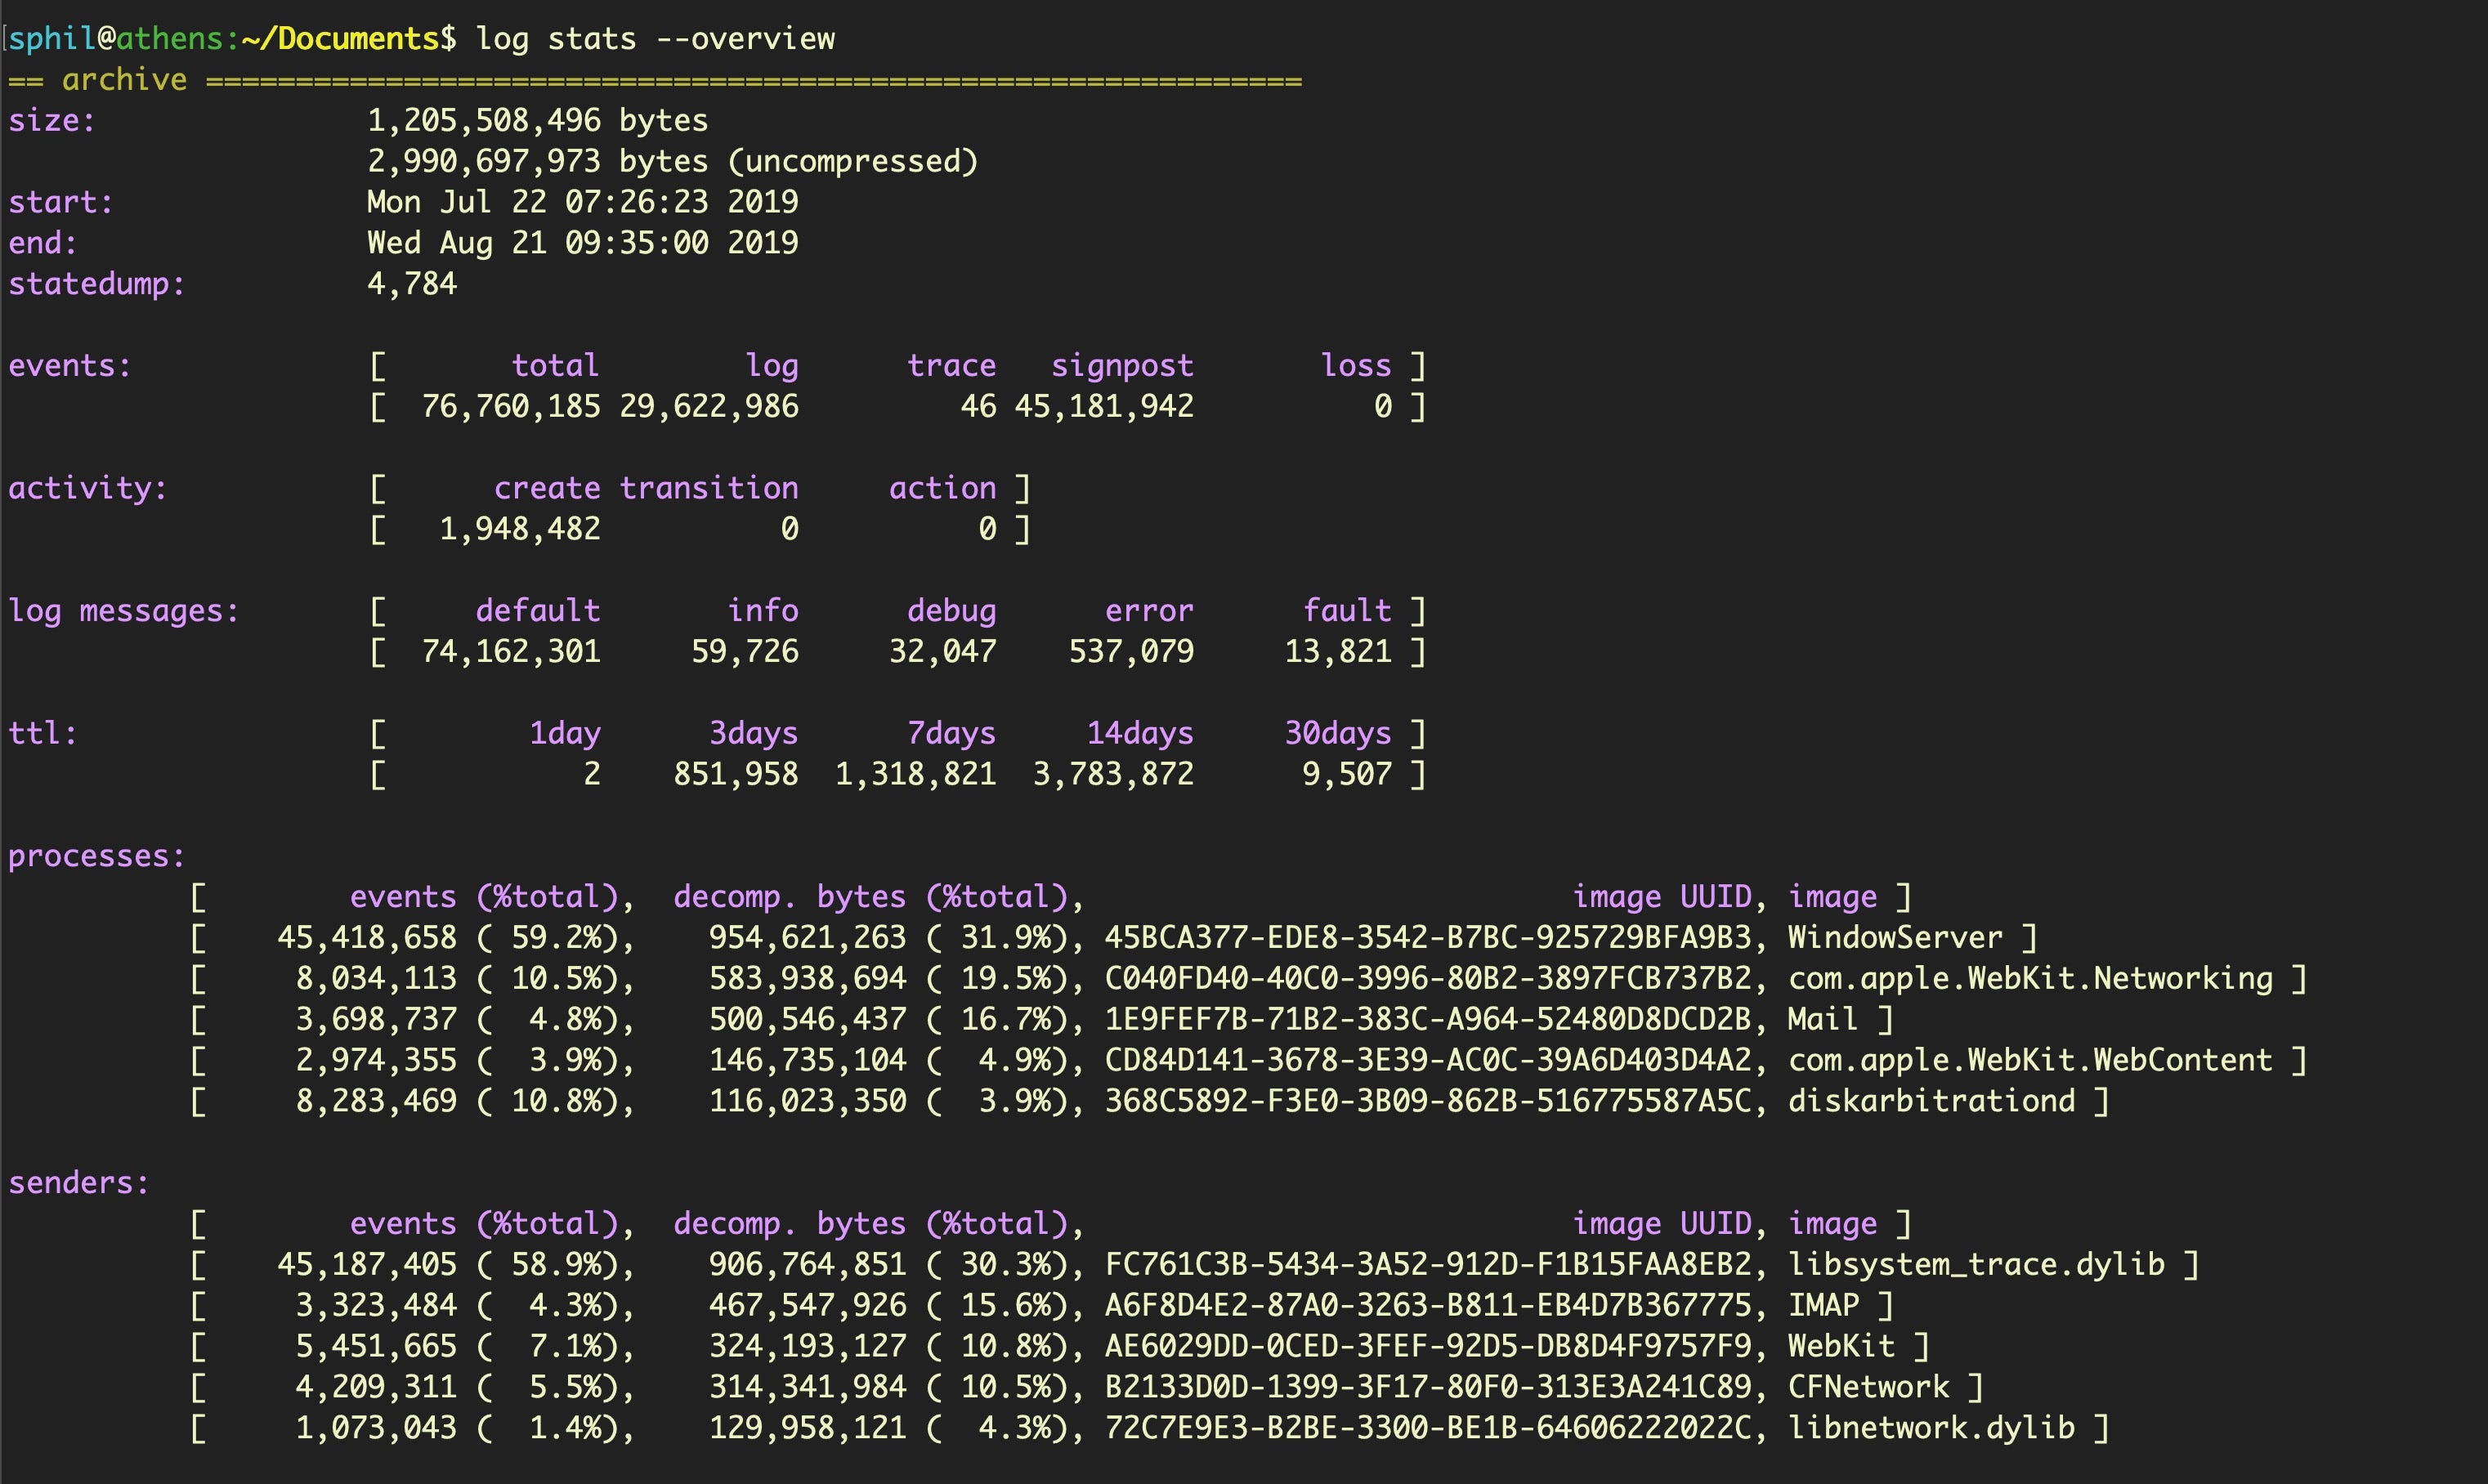
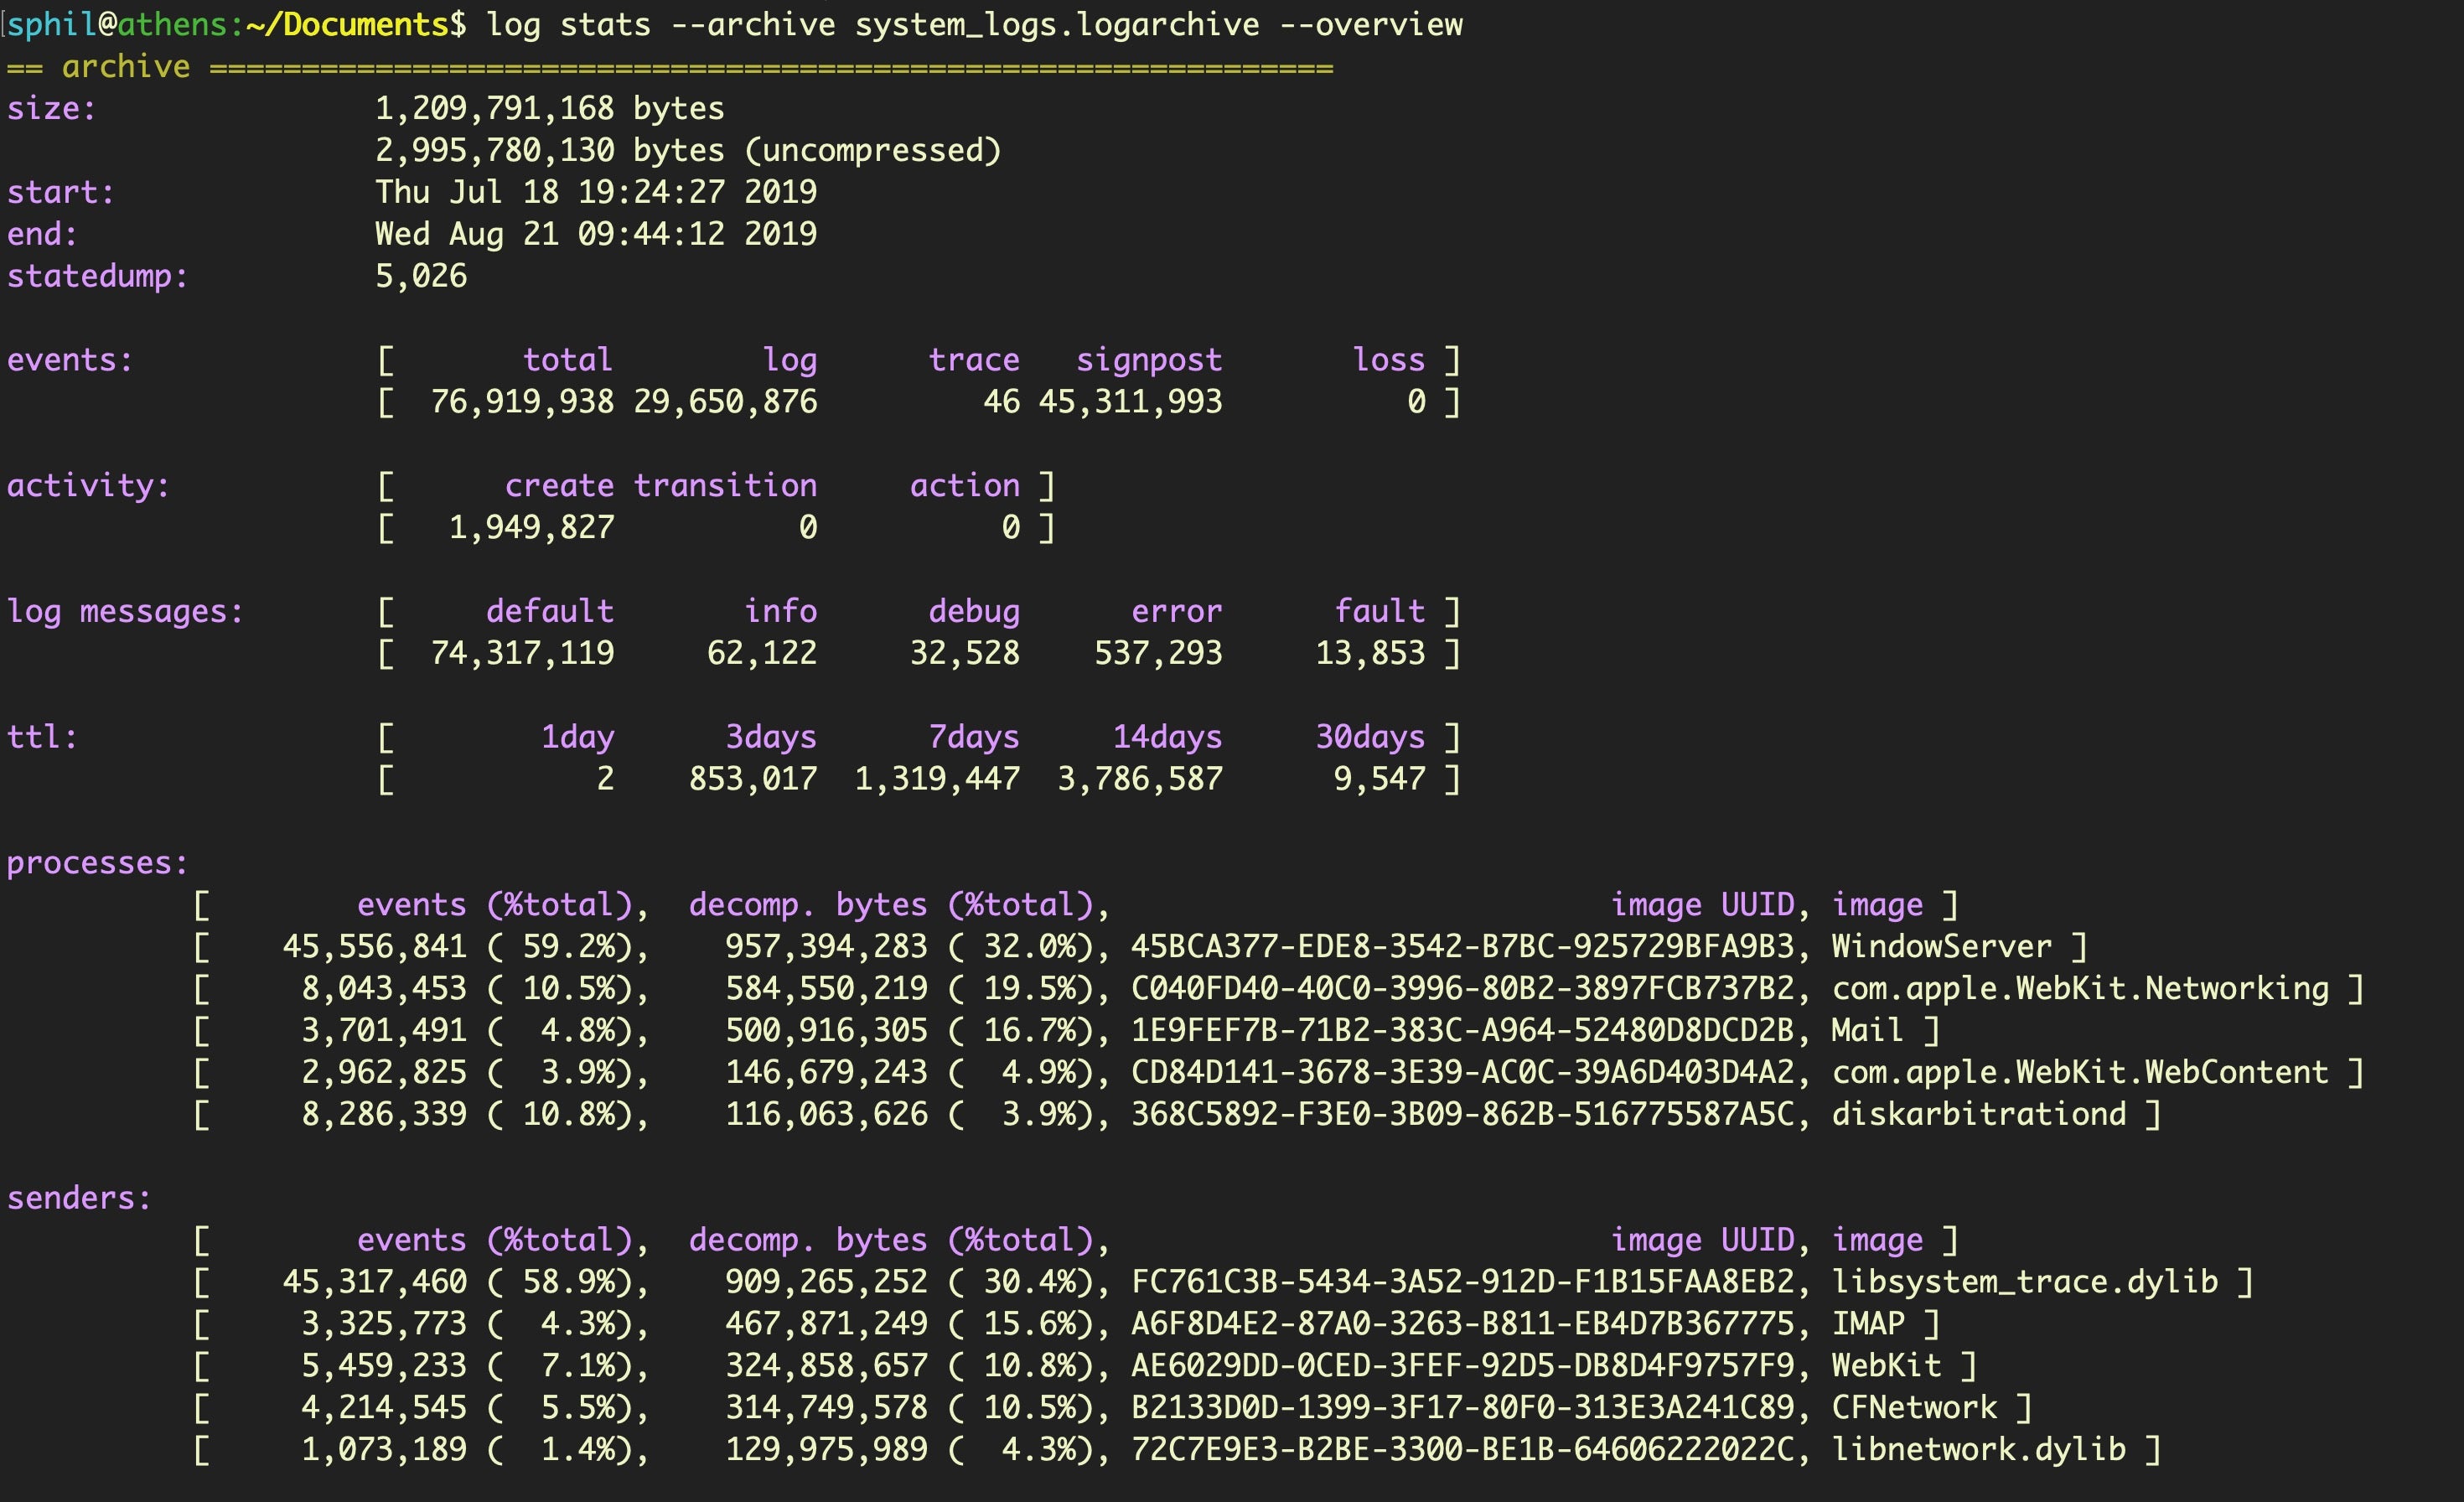
That’s quite a lot more (and also quite a lot larger!) and covers around 30 days worth of logs, from July 22nd to August 21st. To collect all the log info, run a separate collection command. Be sure to specify a destination that is safe to write to (such as a connected device or quarantined folder) as by default the collect verb will save to the current working directory.
$ sudo log collect --output <path to dst>
The other oddity of this tool is that if you run the stats command on your newly collected log file, you may find it contains logs reaching even further back in time than the previous output of --overview indicated. In this case, the collect command appears to have reached back an additional 4 days, to 18th July.
The cause of these oddities is unknown (at least to me) – whether it’s a bug or intended behavior – but the vagaries of the log command are worth bearing in mind.
Exploring fs_usage for File Activity
One other file we’ll mention in the sysdiagnose folder before moving on is fs_usage.txt. This gives you a capture of file activity when you ran the sysdiagnose utility. It is useful to see what was occurring at the time of collection. You can quickly parse fs_usage.txt to get a list of every process that was involved in file activity. Try to cd into the sysdiagnose parent directory, then use something like the following to uniquely list processes that were interacting with the file system:
$ awk '{print $NF}' fs_usage.txt | cut -d. -f1 | sort -u
AirPlayXPCHelper
CoreServicesUIAg
Electron
Finder
Opera
Slack
...snip...
Telegram
UserEventAgent
WireGuardNetworkExt
WireGuardNetworkExtension
We can do something similar to quickly get a list of all file paths that were accessed. Note we’re grepping out files accessed by sysdiagnose itself to ignore our own activity:
$ awk '{print $0}' fs_usage.txt | grep '/' | sort -u | grep -v -i sysdiagnose
However, as fs_usage only records file activity at the time we ran the utility, we need something better to provide historical records of file events.
FSEvents – Old, Not Obsolete
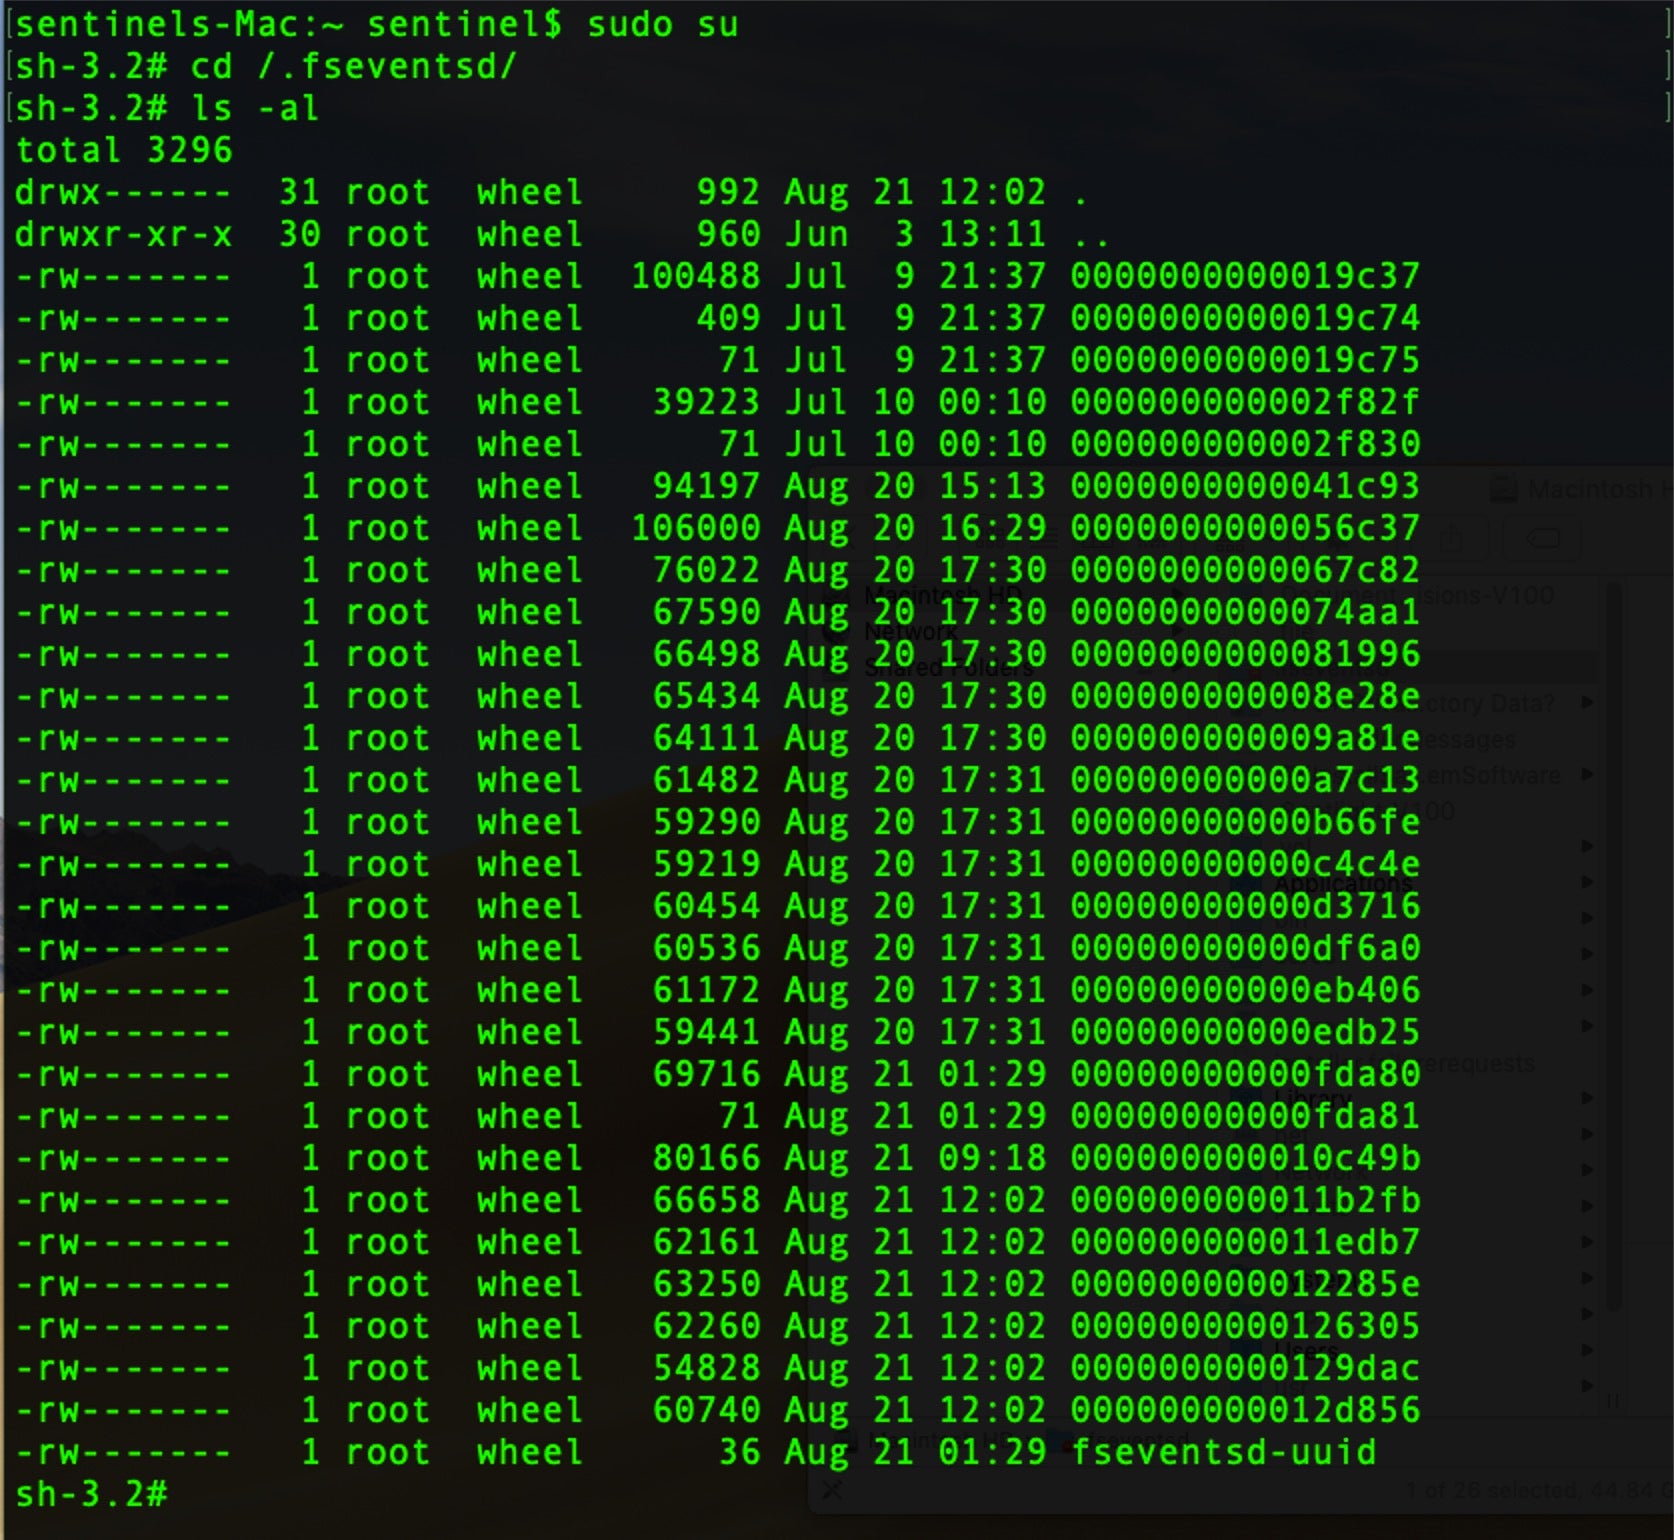
Fortunately, such records of file system events are created in a hidden folder at the root of each volume or disk image.
/.fseventsd
You can easily toggle visibility of this and other useful hidden folders in the Finder by using the keychord:
Command-Shift-Period
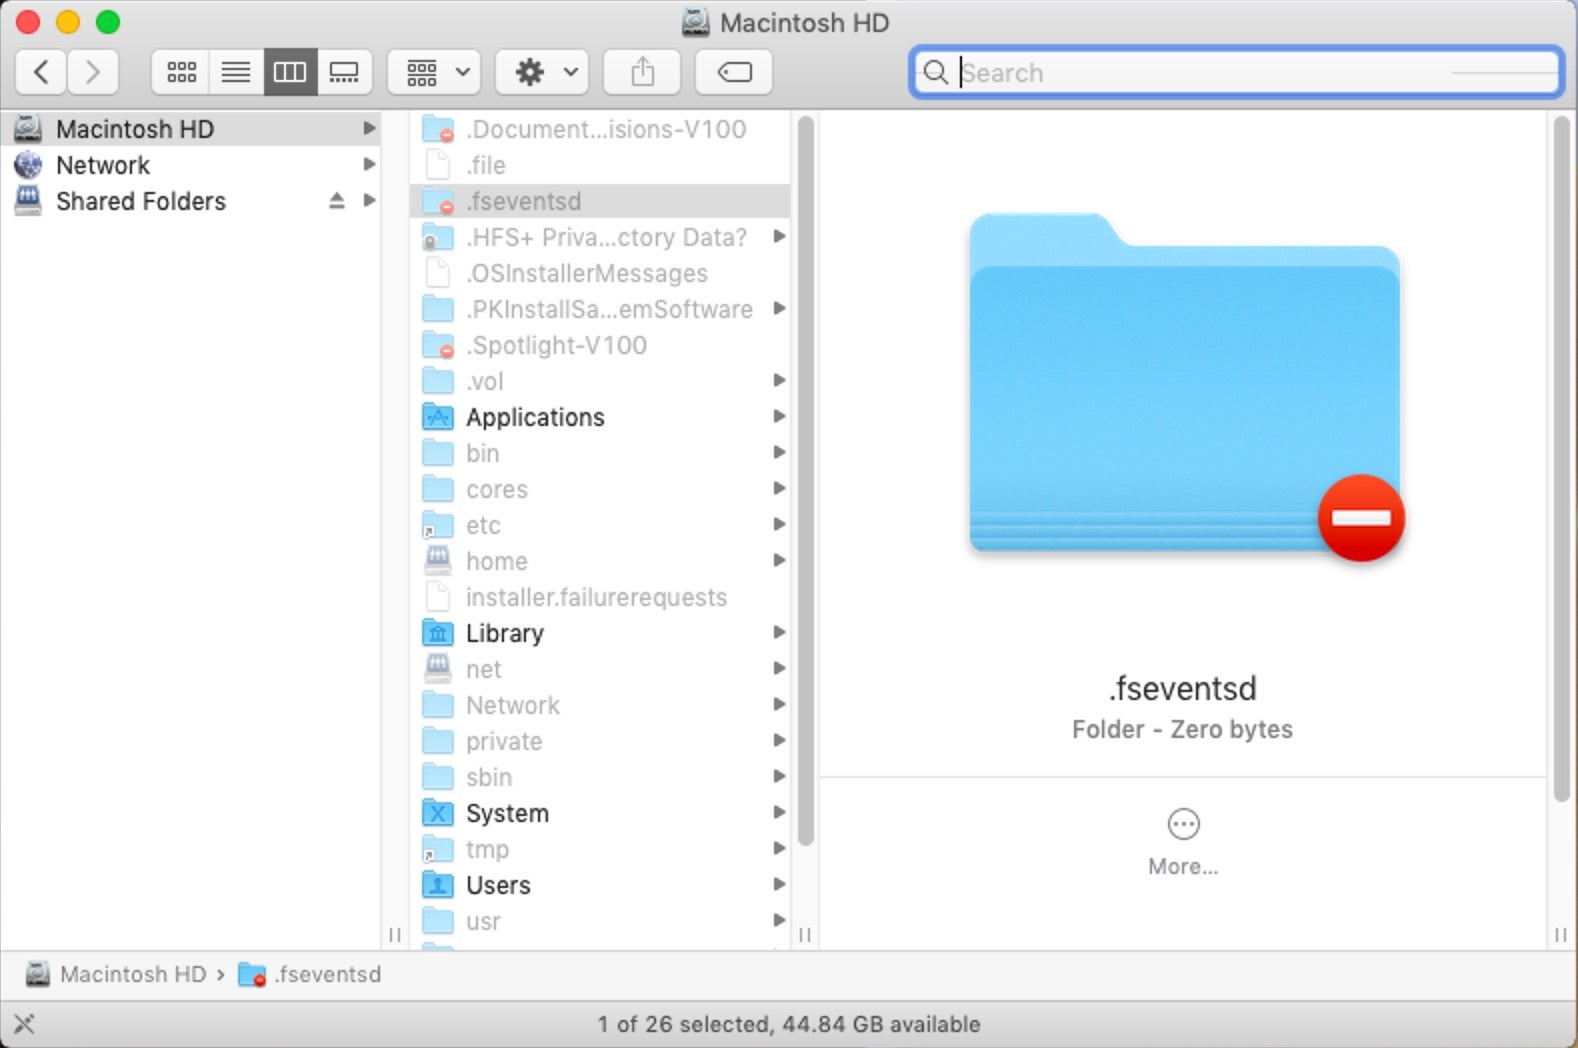
As we see in the image above, this folder is protected, so we will need to drop down to root on the command line to inspect it.
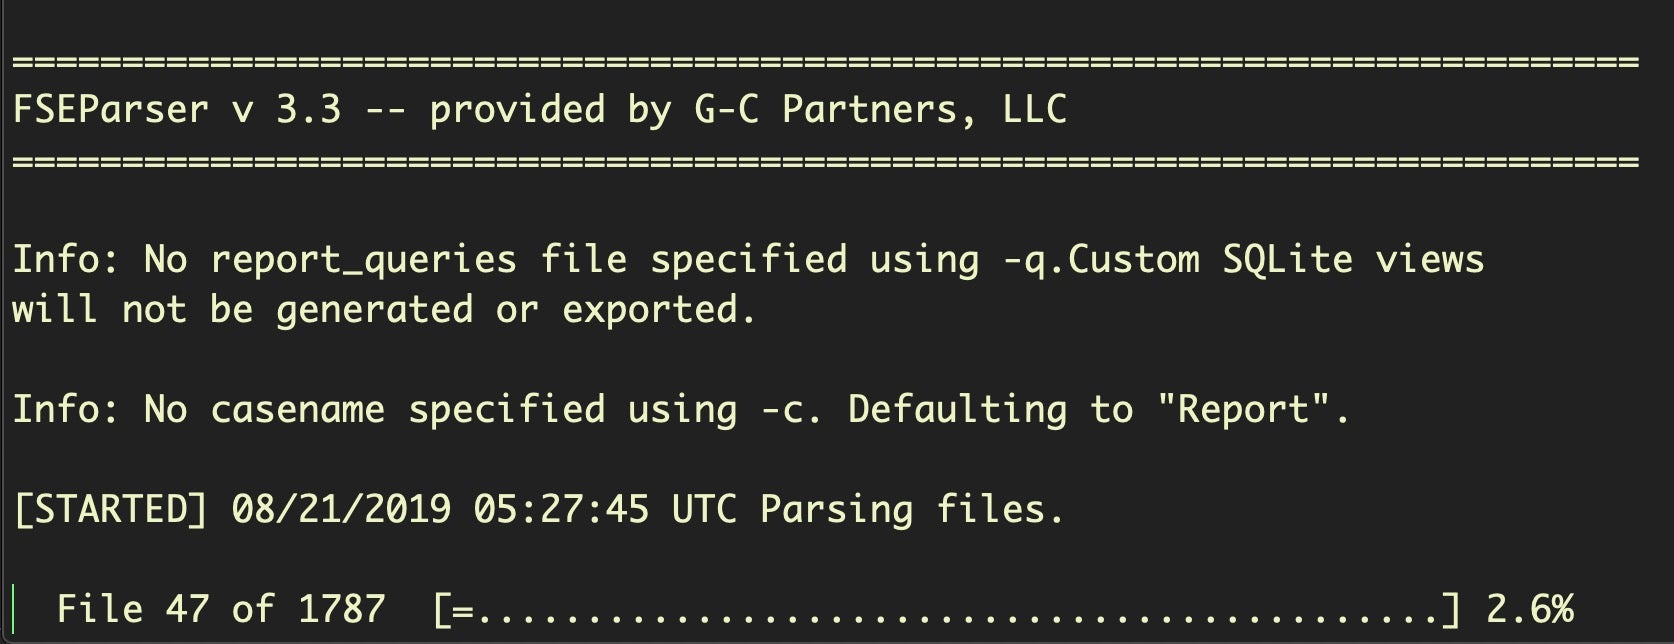
The .fseventsd folder contains data files compressed with gzip. Although we could manually unzip each file, hexdump it or extract the printable characters with strings, that all requires a lot of labor and the results are likely to lose context. A better solution is to use the free tool FSEventsParser. This has the ability to create both SQL database and spreadsheet output, giving us access to much more powerful queries and analysis.
Running the tool in its most basic form requires specifying the source and destination folders (more recent versions also require the -t switch and either folder or image for a value). Depending on the number of records, this may take some time.
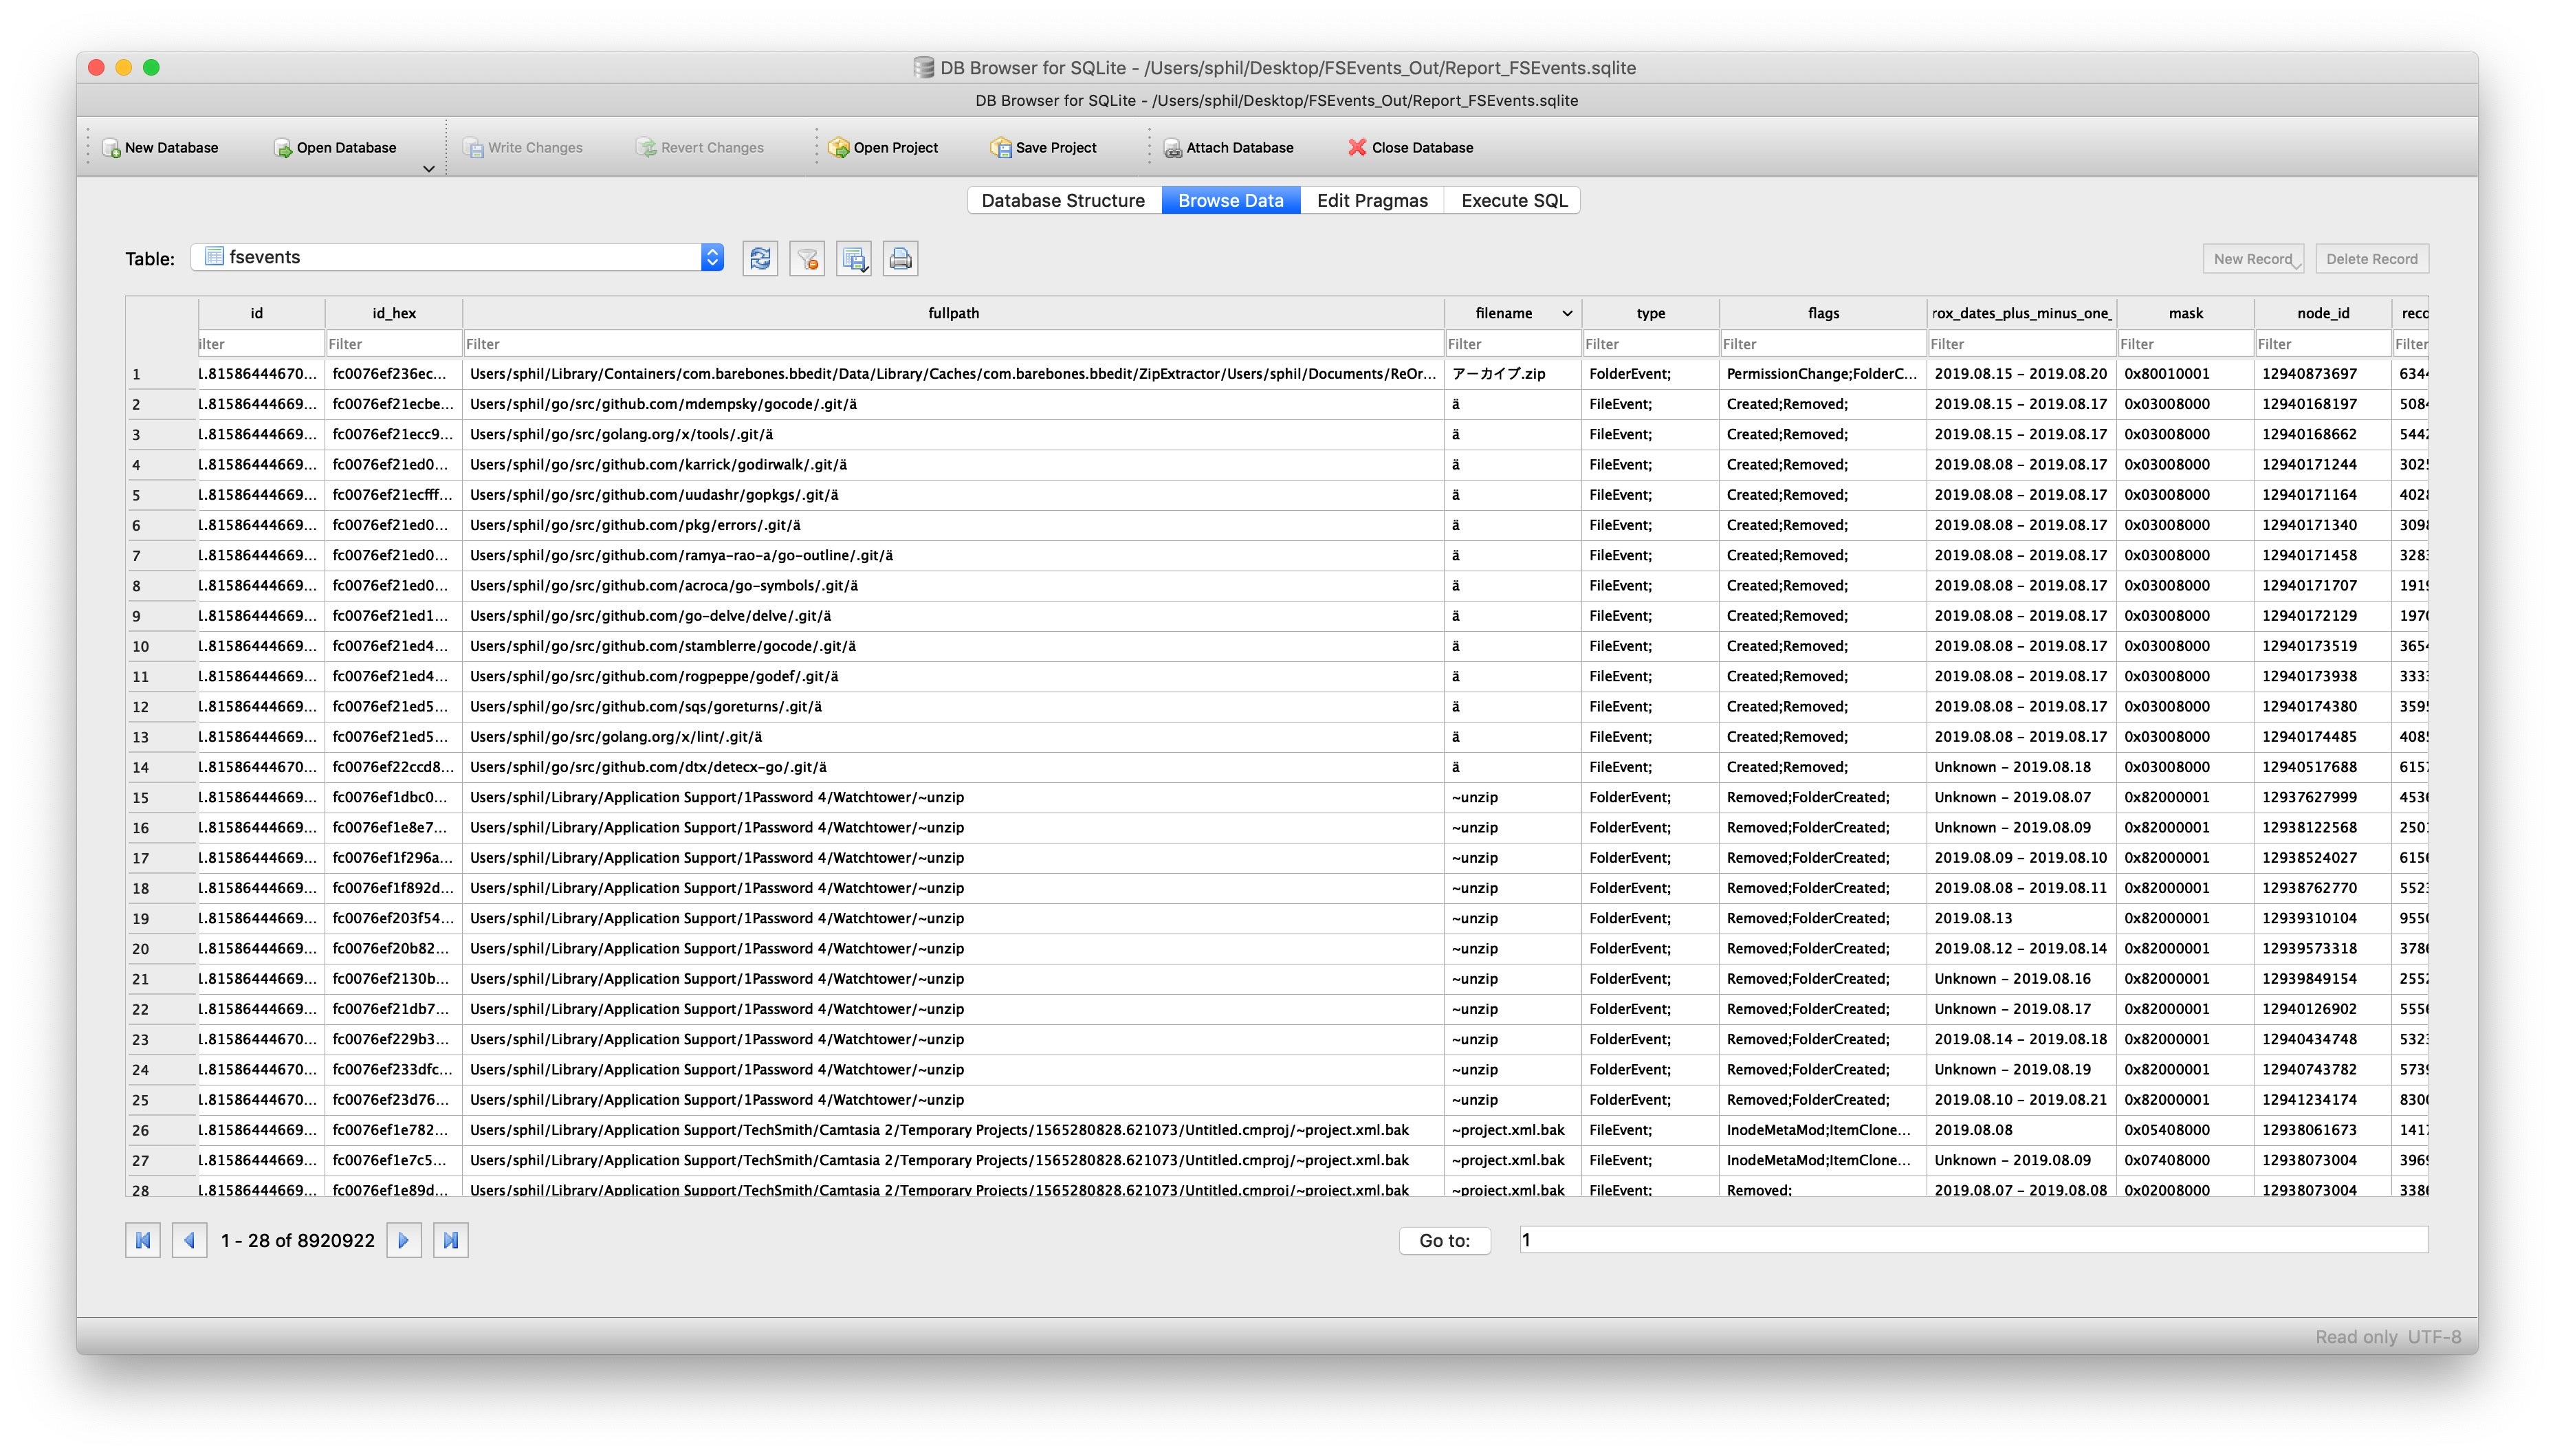
$ python FSEParser_V3.3.py -s -t folder /.fseventsd -o /Users/sentinel/Desktop/FSEvents_Out
The output, however, is well worth it. With FSEvents, we can conduct queries such as which files were sent to the Trash, what devices were mounted, which files were accessed or what websites were visited on a particular date.
Like the unified logs, .fseventsd will only reach back a limited timespan as the records are continually churned to save space. How far back depends on a number of factors, including how active the system is, but if your suspicious events occurred close enough to the collection time, you may well have some extremely rich data that you can mine for evidence of malicious activity.
Be aware that activities like updating the OS will wipe out existing logs in the .fseventsd folder (you can use the install.log in the sysdiagnose folder to determine when the most recent update occurred), and it’s also not unheard of for some events to fail to be recorded at all, such as during especially heavy I/O activity.
Another issue to bear in mind is that users can deliberately prevent the system from recording FSEvent activity by creating a touch file inside the .fseventsd folder.
$ sudo touch /.fseventsd/no_log
What all that means is that you can’t assume something didn’t happen just because you didn’t find a record of it in .fseventsd. However, what you do find can often prove extremely illuminating.
Conclusion
In this introduction to incident response on macOS, we’ve taken a look at three built-in tools – sysdiagnose, unified logging and FSEvents – that can help you quickly collect device, file and environmental data about a Mac. Due to the breadth of the subject, there’s a lot we didn’t cover here, but hopefully we’ve given you enough of a taste to explore further. In the next post in this series, we’ll take a look at some of the hidden databases that reveal user activity. See you there!
Like this article? Follow us on LinkedIn, Twitter, YouTube or Facebook to see the content we post.
Read more about Cyber Security
- macOS Incident Response | Part 2: User Data, Activity & Behavior
- macOS Incident Response | Part 3: System Manipulation
- What’s New with Bluekeep? Are Your Devices Vulnerable?
- OSX.Fruitfly Recycled | macOS Still Vulnerable to ‘Old’ Perl Script
- Don’t Get Left Behind – Why Apple’s macOS Isn’t Secure Without Next Gen Protection