


Are you using AWS Lambda and looking for the best way to log? Or do you need a starting point? Your AWS Lambda functions can log to the CloudWatch service. Let’s look at how to start with AWS CloudWatch logging and how we can use it to its full potential.
![]()
Types of Logging With AWS Cloud Watch
Basic Logging
Whenever your Lambda function is invoked, you’ll see at least three lines in CloudWatch:
- a START line
- an END line
- a REPORT line
These contain some AWS technical details like the request ID, the version of the Lambda function, and resource usage of the execution.
Of course, you’ll want to add your own log lines. Anything you write to stdout or stderr becomes a new line in your CloudWatch logs. AWS will add some info like the date and time, the request ID, and the log level.
We’ve written before about logging for many different languages: C#, Ruby, Python, Node.js, Java, and more. If it can write to the stdout and stderr streams (and all languages can), then it can write CloudWatch logs.
Here are some examples:
System.Console.Out.WriteLine("Starting calculation"); // C#

process.stdout.write("Starting calculation"); // Node.js

sys.stdout.write("Starting calculation") # Python

System.out.println("Starting calculation"); // Java
This will give you log entries that look something like this:

That’s a good starting point and you can add to it by logging all the information necessary to investigate issues that arise with your Lambda functions. But we can do better.
Structured Logging
Structured logging is where instead of just logging a line of text, you log a structured object, most often as JSON. This will allow you to search the logs more easily.
The easiest way to use structured logging is to log in JSON. So instead of logging “Starting calculation,” as in the example above, we would log a JSON object like this:
{
    "msg": "Starting calculation",
    "dateTime": "2020-05-29T09:43:00.000Z",
    "level": "INFO",
    "awsRequestId": "2e088258-de57-4d85-b069-a3fbbc5964c3",
    "user": "peter.morlion",
    "input": {
        "x": 4,
        "y": 85
    }
}
You’ll probably have to serialize this to a string.
You can add whatever information is necessary or useful for you. We’ll see how to search structured logs below. First, let’s look at how CloudWatch logging is actually organized.
CloudWatch Log Groups and Log Streams
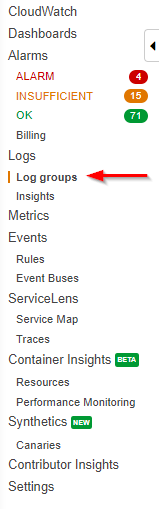
Each Lambda function gets its own log stream in CloudWatch. If you go to CloudWatch in your AWS console, you can select Log groups in the navigation pane on the left:
This will load the list of log groups, which you can filter by typing in the search box:
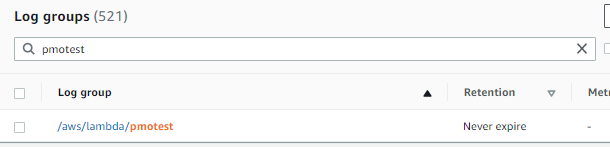
Each log group belongs to a single Lambda function; each group contains streams (log streams) of log entries. Each log stream belongs to a single instance of your Lambda function, and one instance of the Lambda function can handle multiple incoming requests or events.
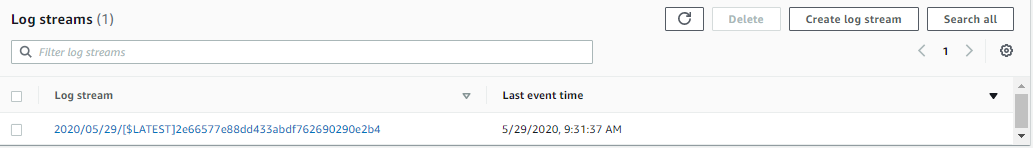
When you select a log group, you’ll see a list of the log streams:
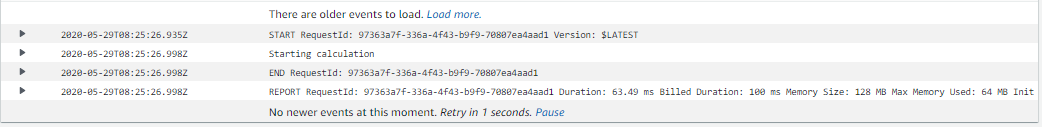
Select a stream and finally, you’ll see the entries:
If you rarely log or you have few cases of concurrent executions, this interface works fine. But it doesn’t have a very powerful way of searching logs. That’s a big problem when you have thousands of log entries split up over many log streams, which is why I recommend using Log Insights instead.
CloudWatch Insights
You’ll find Insights under the Log groups link in the left-hand navigation pane of CloudWatch. First, open the dropdown menu and select the log groups you want to search:
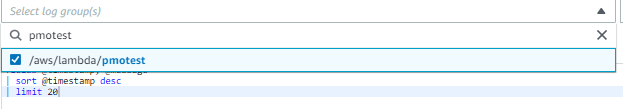
This is where Insights is already better than using the log groups because with Insights you can search multiple log groups together.
Once you’ve selected the groups to search, you can select the time range you wish to search in the top right corner of the page:
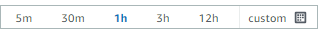
You can choose a time period relative to the current moment in time, or define a custom time range.
Then you can enter your search query, and this is where Insights shines if you’re using structured logging. If you run a basic query first, you can then open the Fields pane to the right of the search interface to see the fields you can include in your query:
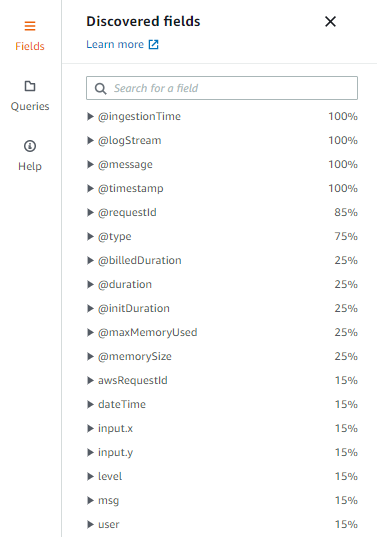
See how the fields of our JSON object are included? Insights makes them available to use in our queries after we run our first query. For example, if we want to find all log entries where the user is “peter.morlion” we would use this query:
fields @timestamp, @message
| filter user = "peter.morlion"
| sort @timestamp desc
| limit 20
This will give us the following result:

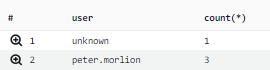
CloudWatch Insights has a powerful query syntax that we can’t entirely cover here. But here’s one example to give you a taste: We can group our log entries to see how many calculations were performed per user in our example:
stats count(*) by user
| filter msg = "Starting calculation"
This is the result:
Best Practices
I’ve already mentioned structured logging. This is almost a no-brainer and the benefits are massive. Once you’ve had to investigate an issue and experienced the benefit of structured logging, you’ll never want to go back to basic logging.
Here are some additional best practices.
Include Common Fields for Search
Certain fields are interesting to include in each log entry. Things that come to mind are the following:
- a correlation ID: to correlate requests from different systems or other Lambda functions
- a tenant: if you’re running a multi-tenancy service, include the tenant ID
- username
- the AWS request ID: this allows you to see all log entries for a single request
Including common fields in each entry gives you more options for statistical queries.
Set a Log Retention Period
Your logs will be kept indefinitely, which increases your AWS bill over time. That’s why it’s best to set a log retention period. Doing so makes AWS automatically clean up logs that are older than the given time period.
To set the retention period, select a log group and open the Actions menu in the top right of the page and find the option to edit the retention setting:
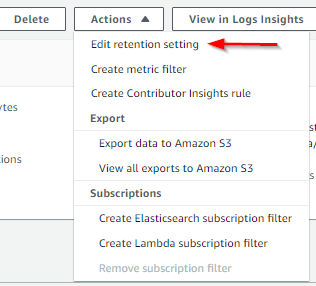
Choose a time period that works for you and you’re good to go.
Log Input and Output
I always recommend logging the incoming and outgoing data. For example, in the case of an HTTP request, I would log the request body and headers, and the outgoing response body and status code. You can log the different steps that happen in between as well, but these two are the minimum data needed to verify what your Lambda function received and sent back.
Correlate Functions
When you use AWS Lambda functions, you might call one function from another. A single HTTP request could result in the execution of multiple Lambda functions under the hood.
When you need to troubleshoot a function, it will be difficult to find the exact point where things went wrong.
I remember a case where one Lambda function called another. To see the correlating log entries, I first found the correct log entries in one log group and took note of the date and time. Then I had to search the log entries of the other function at that date and time. This works if you don’t have a lot of concurrent executions, but it’s clunky to say the least. It gets near impossible if there are thousands of executions at the same point in time.
Adding a correlation ID that’s passed from one function to another makes this a lot easier. If you add the correlation ID each time you add a log entry, later you can query your logs for that correlation ID and see all log entries for the specific request.
The Usual Suspects
There are several other best practices when logging. We’ve covered them before in other blog posts, but it’s good to review them.
At a very minimum, you should log a timestamp, the log level, and a human readable message. In the case of AWS Lambda functions, I recommend also logging the AWS request ID. You can find it in the context parameter that’s passed as the second argument to your function.
You might also consider logging the AWS Lambda function name. When you’re using Insights to show the log entries of multiple functions together, the function name can be useful.
There are also things you should not log. Passwords are the obvious one. But you should also be careful with these:
- credit card numbers
- email addresses
- social security numbers
- encryption keys
- API keys
Any personally identifiable information (PII) should be logged only after really thinking it through (and possibly after talking with your privacy officer, if you have one).
CloudWatch and Scalyr
So what does this all mean for Scalyr? Well, if you’re already using Scalyr, you can stream your CloudWatch logs to Scalyr. Many organizations have some applications running on-premises and other applications running on AWS. With Scalyr, you can keep all your logs in one place.
AWS CloudWatch is more than just logging. It’s a collection of features that includes monitoring, alerting, tracing, dashboards, and more.
Scalyr is easy to use and has features similar to those of CloudWatch, like alerts, dashboards, and log querying. But it also boasts some extras like seeing the logs live as they’re being written, and collaboration through annotations or through Slack integration.
AWS Lambda Logging: Not Too Difficult
I hope I’ve shown you how easy it is to log in AWS Lambda functions. In most cases, you’ll be able to log like you do in other applications, with your logging framework of choice. You can then find the logs in AWS CloudWatch. If you have multiple applications running on different platforms (on the premises and in the cloud), be sure to take a look at Scalyr.
